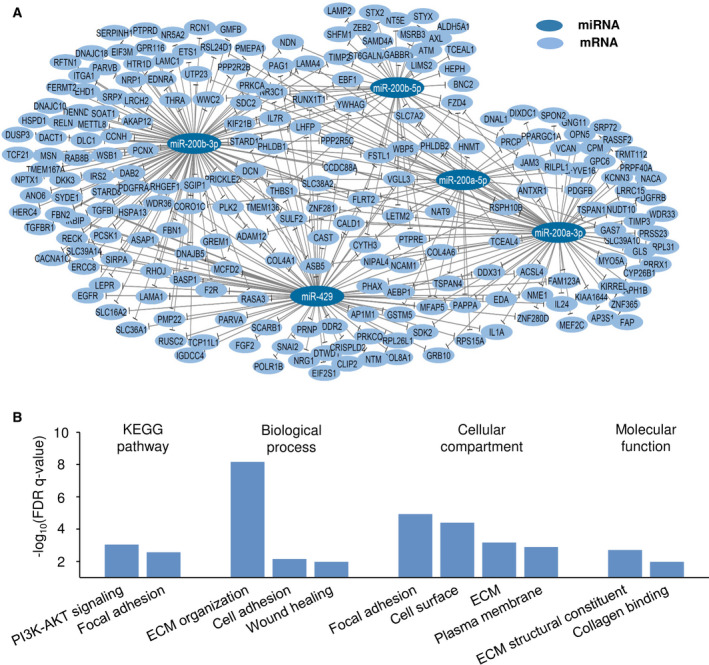
Fig. 4.

Regulatory network and biological processes associated with miR‐200a/b/‐429. (A) miR‐200a/‐b/‐429 regulatory network. Each miRNA in the miR‐200a/‐b/‐429 cluster is used as node. The interaction partners are their potential target genes, identified from correlation analysis of miRNA and gene expression in the explorative cohort (n = 90) and validation cohort 1 (n = 110). The network was visualized using cytoscape software v3.6.1. (B) Enriched KEGG pathways and GO terms in the list of 225 potential miR‐200a/b/‐429 target genes. Y‐axis denotes significance level from the functional annotation tool david v6.8.
