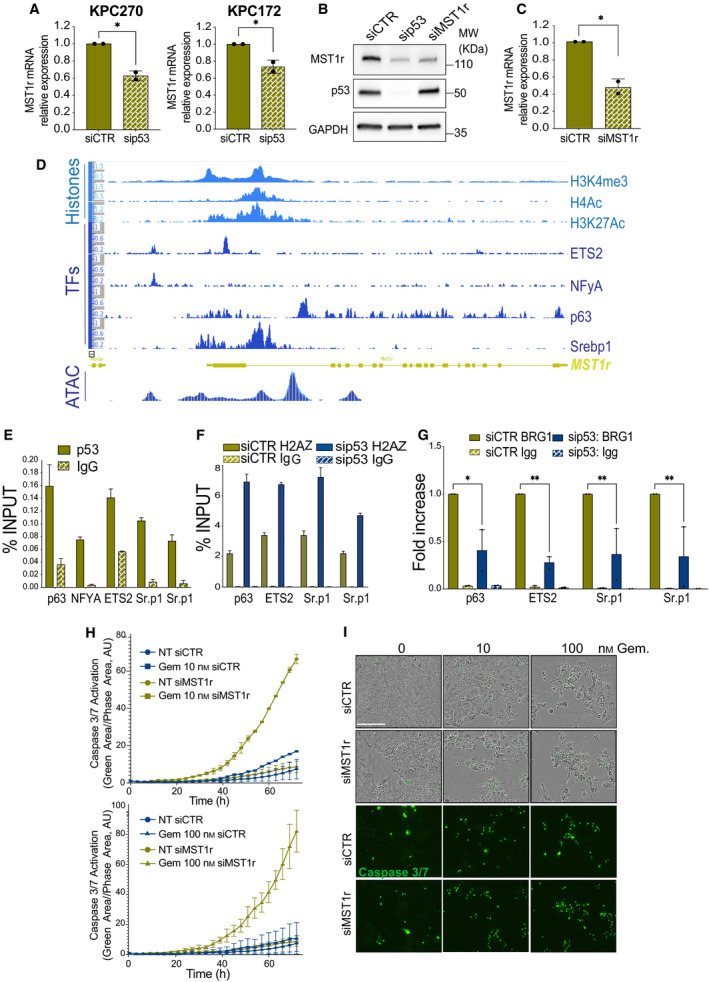
Fig. 3.

p53R270H/MST1r axis confers drug tolerance to pancreatic cancer. (A‐C) RT‐qPCR (n = 2) and western blot display mRNA or protein level of MST1r following p53R270H or p53R172H silencing in KPC cells. Bars indicate SD. Experiments were repeated at least three times. A t‐test was calculated (P‐value < 0.05). (D) ChIP‐seq profile of histone post‐translational modifications, transcriptional factor (TF) binding and ATAC‐seq in the genomic region of mouse MST1r. (E‐G) ChIP‐qPCRs report p53R270H binding (E), H2AZ content (F) or Brg1 binding (G) in the region corresponding to p63, ETS2 and Srepb1 (Sr.p1) binding (from panel (D) in KPCR270H‐untreated cells (E) or following p53R270H silencing (F and G). E and F report representative replicates of at least three independent biological replicates (bars indicate SD of technical replicates), G reports an average of fold over control of two independent biological replicates (bars indicate SE of biological replicates), two‐way ANOVA test was used, P‐values: * P < 0,05 and ** P < 0.01. (H,I) In vivo live‐cell imaging analysis by IncuCyte platform measured cell growth (phase contrast) and caspase‐3/7 activation (fluorescent green area) in KPCR270H cells following MST1r silencing and gemcitabine (Gem) treatment. Scale bar indicates 200 microns. The data show a representative experiment of two biological replicates.
