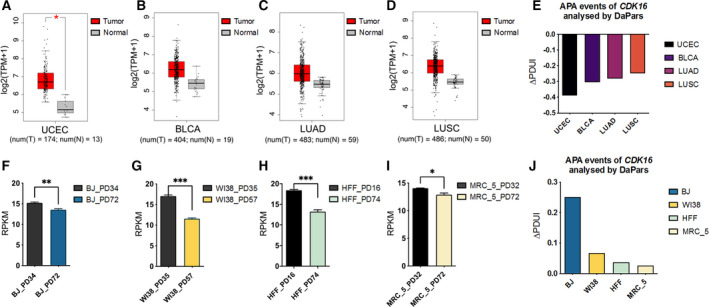
Fig. 1.

The expression pattern and 3′UTR length changes of CDK16 in cancer and senescence. (A) Higher CDK16 expression in UCEC tumors compared with matched normal tissues based on TCGA RNA‐seq datasets archived in GEPIA database [60]. The red and grey boxes represent the CDK16 expression levels in TCGA tumors (T) and matched TCGA normal tissues (N), respectively. The expression level was displayed as log2(TPM + 1) denoted in Y‐axis. The number (num) of samples was marked below the graph, num(T) = 173, num(N) = 13. * represents P < 0.05 based on one‐way ANOVA. (B) Higher CDK16 expression in BLCA tumors compared with matched normal tissues. num(T) = 404, num(N) = 19. (C) Higher CDK16 expression in LUAD compared with matched normal tissues. num(T) = 483, num(N) = 59. (D) Higher CDK16 expression in LUSC compared with matched normal tissues. num(T) = 486, num(N) = 50. The horizontal lines within each box represent the median values, the box spans the first quartile to the third quartile (interquartile range, IQR), and the whiskers represent 1.5 × IQR. (E) APA‐mediated 3′UTR shortening of CDK16 in four cancer types compared to matched normal tissues based on DaPars analysis on public RNA‐seq data [62]. Y‐axis stands for the APA usage changes denoted by ΔPDUI. ΔPDUI value was calculated by subtracting the PDUI value in normal tissues from the PDUI value in each cancer type. (F) Reduced CDK16 expression in senescent human fibroblasts BJ (Population Doubling 72, PD72) compared to corresponding young cells (PD34) based on public RNA‐seq datasets [61]. The expression level was indicated by RPKM. (G) Reduced CDK16 expression in senescent (PD57) compared with young (PD35) human embryonic lung fibroblasts WI38. (H) Reduced expression of CDK16 in HFF at PD74 than that at PD16. (I) Decreased CDK16 expression in PD72 of human lung fibroblasts MRC_5 than in PD32. For panel F–I, unpaired t‐test was performed based on three biological replicates. *, **, *** represent P < 0.05, P < 0.01, P < 0.001, respectively. Error bars indicated mean ± SEM. (J) APA‐mediated 3′UTR lengthening of CDK16 in the four human senescent cells compared to young cells based on public RNA‐seq data mentioned above. The positive ΔPDUI value quantified by DaPars represents 3′UTR lengthening in senescent cells compared to relatively young cells.
