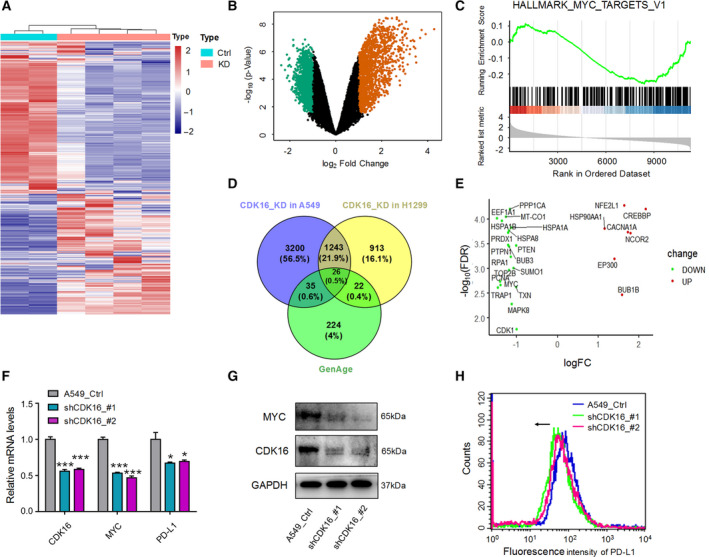
Fig. 6.

CDK16 KD leads to reduced MYC and membranous PD‐L1 expression in lung cancer cells. (A) Heatmap showing the DEGs between CDK16‐KD and control (Ctrl) A549 cells, each sample has two technical replicates. (B) Volcano map showing up‐ and down‐regulated genes in CDK16‐KD A549 cells. (C) GSEA using H collection (Hallmark gene sets) to display the enrichment of down‐regulated genes above targeted by MYC. (D) Venn diagram showing the relationship between DEGs in CDK16‐KD A549 (or H1299) cells and the human senescence‐associated genes archived in the GenAge database (https://genomics.senescence.info/genes/) [73]. (E) Differential expression analysis of 26 overlapping genes. Up‐regulated (UP) and down‐regulated (DOWN) genes were marked respectively according to their fold change (FC) in A549 cells. (F) qRT‐PCR to detect the reduced expression of MYC and PD‐L1 in CDK16‐KD A549 cells. GAPDH was used as the internal control. *, *** represent P < 0.05 and P < 0.001 based on t‐test with three independent replicates. Error bars indicated mean ± SEM. (G) Western blot to test the decreased MYC protein expression upon CDK16‐KD in A549 cells. GAPDH serves as the internal control. (H) Flow cytometry showing the membranous expression of PD‐L1 on the cell surface of CDK16‐KD A549 cells based on three independent replicates. The arrow denotes a decrease in membranous PD‐L1 expression.
