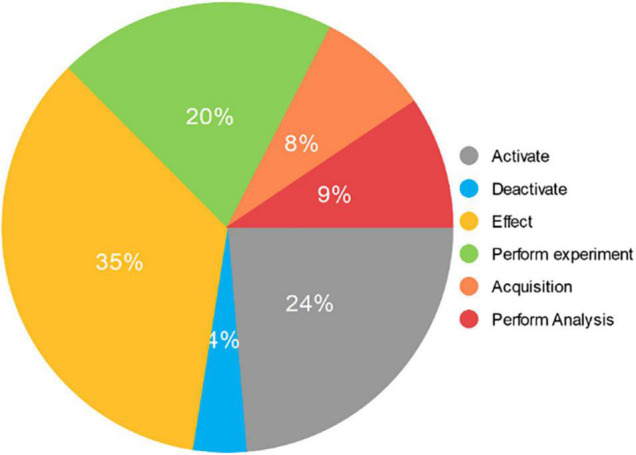
FIGURE 5.

The distribution of event mentions in the experimental data set. It consists of 3331 event mentions extracted from 677 neuroimaging articles. The “Activate” category includes 788 mentions and accounts for 24% of the total. The “Deactivate” category includes 128 mentions and accounts for 4% of the total. The “Effect” category includes 1169 mentions and accounts for 35% of the total. The “Perform experiment” category includes 665 mentions and accounts for 20% of the total. The “Acquisition” category includes 266 mentions and accounts for 8% of the total. The “Perform Analysis” category includes 315 mentions and accounts for 9% of the total.
