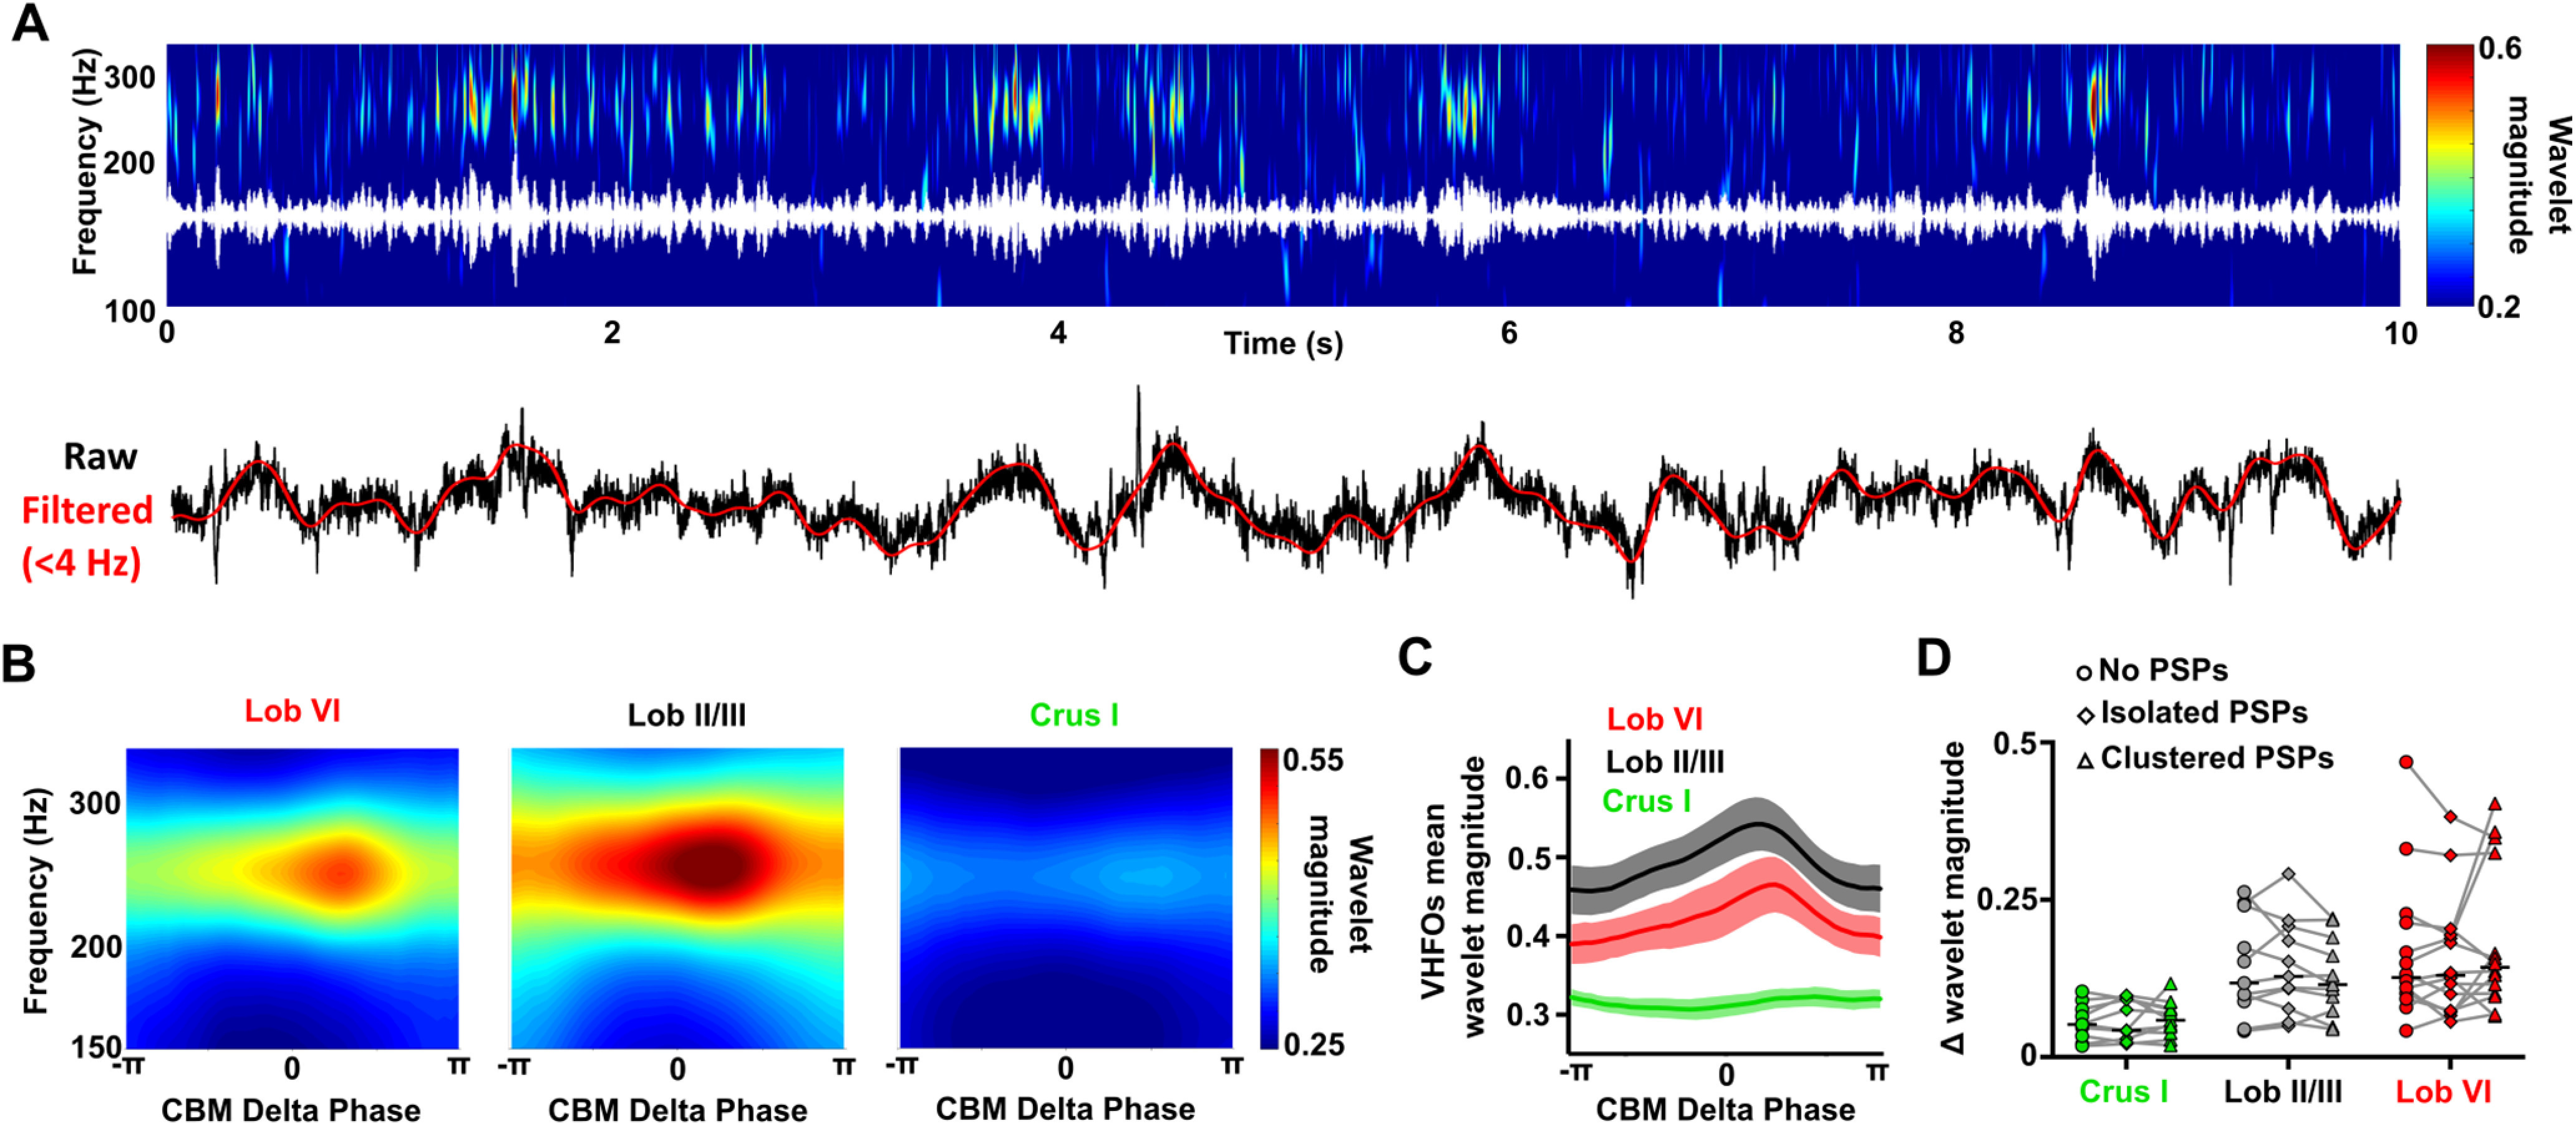
Figure 5.

Modulation of VHFO frequency oscillations by δ oscillations within the cerebellum during REM. A, Representative spectrogram (top; with VHFO frequency filtered trace overlaid in white) and raw cerebellar LFP recordings (bottom; with δ frequency filtered oscillations overlaid in red) showing the modulation of VHFOs by cerebellar δ oscillations during an REM epoch. The cerebellar LFP is dominated by both δ oscillations and VHFOs, which fluctuate dynamically within the ∼250 Hz and <4 Hz ranges, respectively. The fluctuations in cerebellar VHFO power appear temporally aligned to the prominent δ oscillations in the cerebellar LFP. B, Average spectrograms aligned to the phase of the cerebellar (CBM) δ oscillations (<4 Hz) during REM sleep. The power of cerebellar VHFOs appears greatest following the peak of cerebellar δ (zero phase radians) in vermal lobules (VI, II/III) but not Crus I. C, Average cerebellar VHFO power aligned to cerebellar δ oscillation phase. A significant increase in VHFO power was found across δ phase in Lob VI and Lob II/III. D, Effect of PSP abundance during the cerebellar δ oscillations on the modulation of VHFOs during REM. We compared the maximal change in cerebellar VHFO power during cerebellar δ oscillations in which no PSPs, isolated PSPs or clusters of PSPs were detected. No significant differences were observed for the three cerebellar regions. In all mean plots, n = Lob VI, n = 15 mice; Crus I, n = 11 mice; Lob II/III, n = 11 mice. For detailed statistical comparisons, see Extended Data Figure 2-1.
