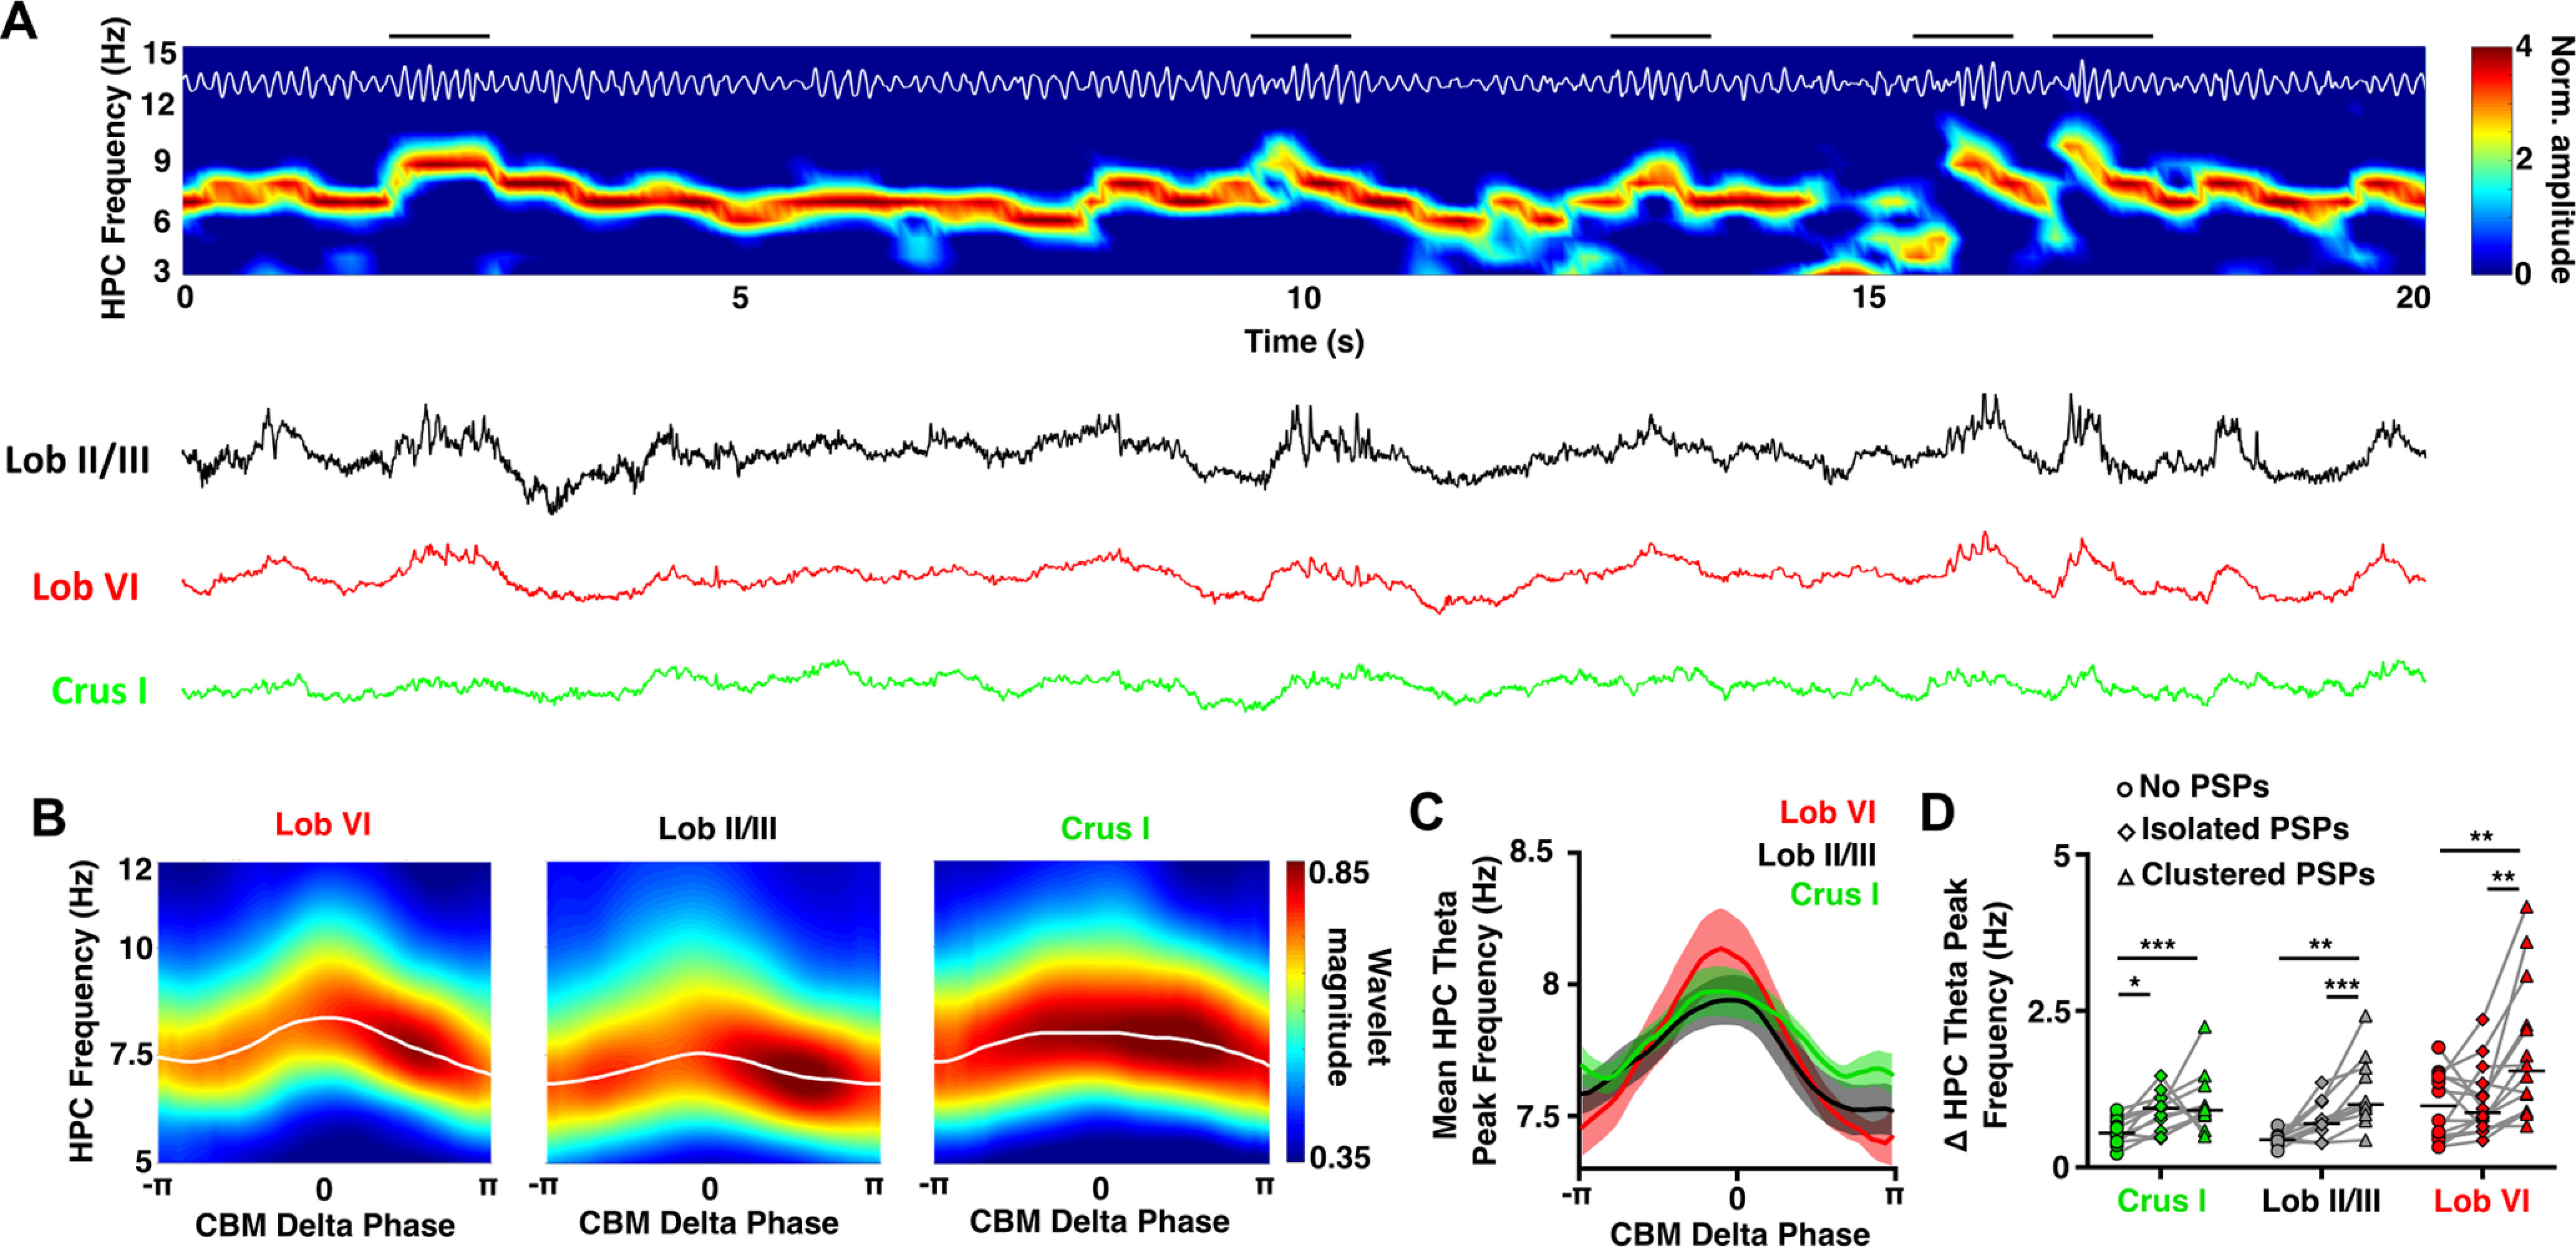
Figure 6.

Modulation of hippocampal theta frequency by cerebellar (CBM) δ oscillations during REM. A, Representative spectrogram (top; with theta filtered trace overlaid in white) and raw cerebellar LFP recordings (bottom) showing the modulation of hippocampal theta frequency by cerebellar δ oscillations during an REM epoch. The hippocampal LFP is dominated by theta oscillations, which fluctuate dynamically within the 6-12 Hz range. These fluctuations in hippocampal theta frequency appear temporally aligned to the δ oscillations dominating cerebellar LFPs (examples of this are indicated by black horizontal bars above spectrogram). B, Average hippocampal spectrograms aligned to the phase of the cerebellar δ oscillations (<4 Hz) during REM sleep. The preferred hippocampal theta frequency (white line, overlaid) shows an acceleration coincident with the peak of the cerebellar δ oscillations: 0 phase radians; maximal frequency of hippocampal theta: triggered from Crus I = 7.97 ± 0.095 Hz at −18.74° (−0.1 π), triggered from Lob II/III = 7.94 ± 0.095 Hz at −3.72° (−0.02 π), triggered from Lob VI = 8.14 ± 0.154 Hz at −18.74° (−0.1 π). C, Average preferred hippocampal theta frequency aligned to cerebellar δ oscillation phase. Significant hippocampal theta frequency acceleration was found from the trough of δ to the peak of δ in all cerebellar regions. However, no differences in hippocampal theta frequency modulation were observed between the δ oscillations recorded across the three cerebellar locations. D, Effect of PSP abundance during the cerebellar δ oscillations on the modulation of preferred hippocampal theta frequency during REM. We compared the maximal change in hippocampal theta frequency during cerebellar δ oscillations in which no PSPs, isolated PSPs, or clusters of PSPs were detected. Significant differences were observed for the three cerebellar regions with a significant increase in the hippocampal theta modulation during δ waves when clusters of PSPs were detected compared with those with no PSPs or isolated PSPs. In all mean plots, n = Lob VI, n = 15 mice; Crus I, n = 11 mice; Lob II/III, n = 11 mice. For detailed statistical comparisons, see Extended Data Figure 2-1. *p < 0.05. **p < 0.01. ***p < 0.001.
