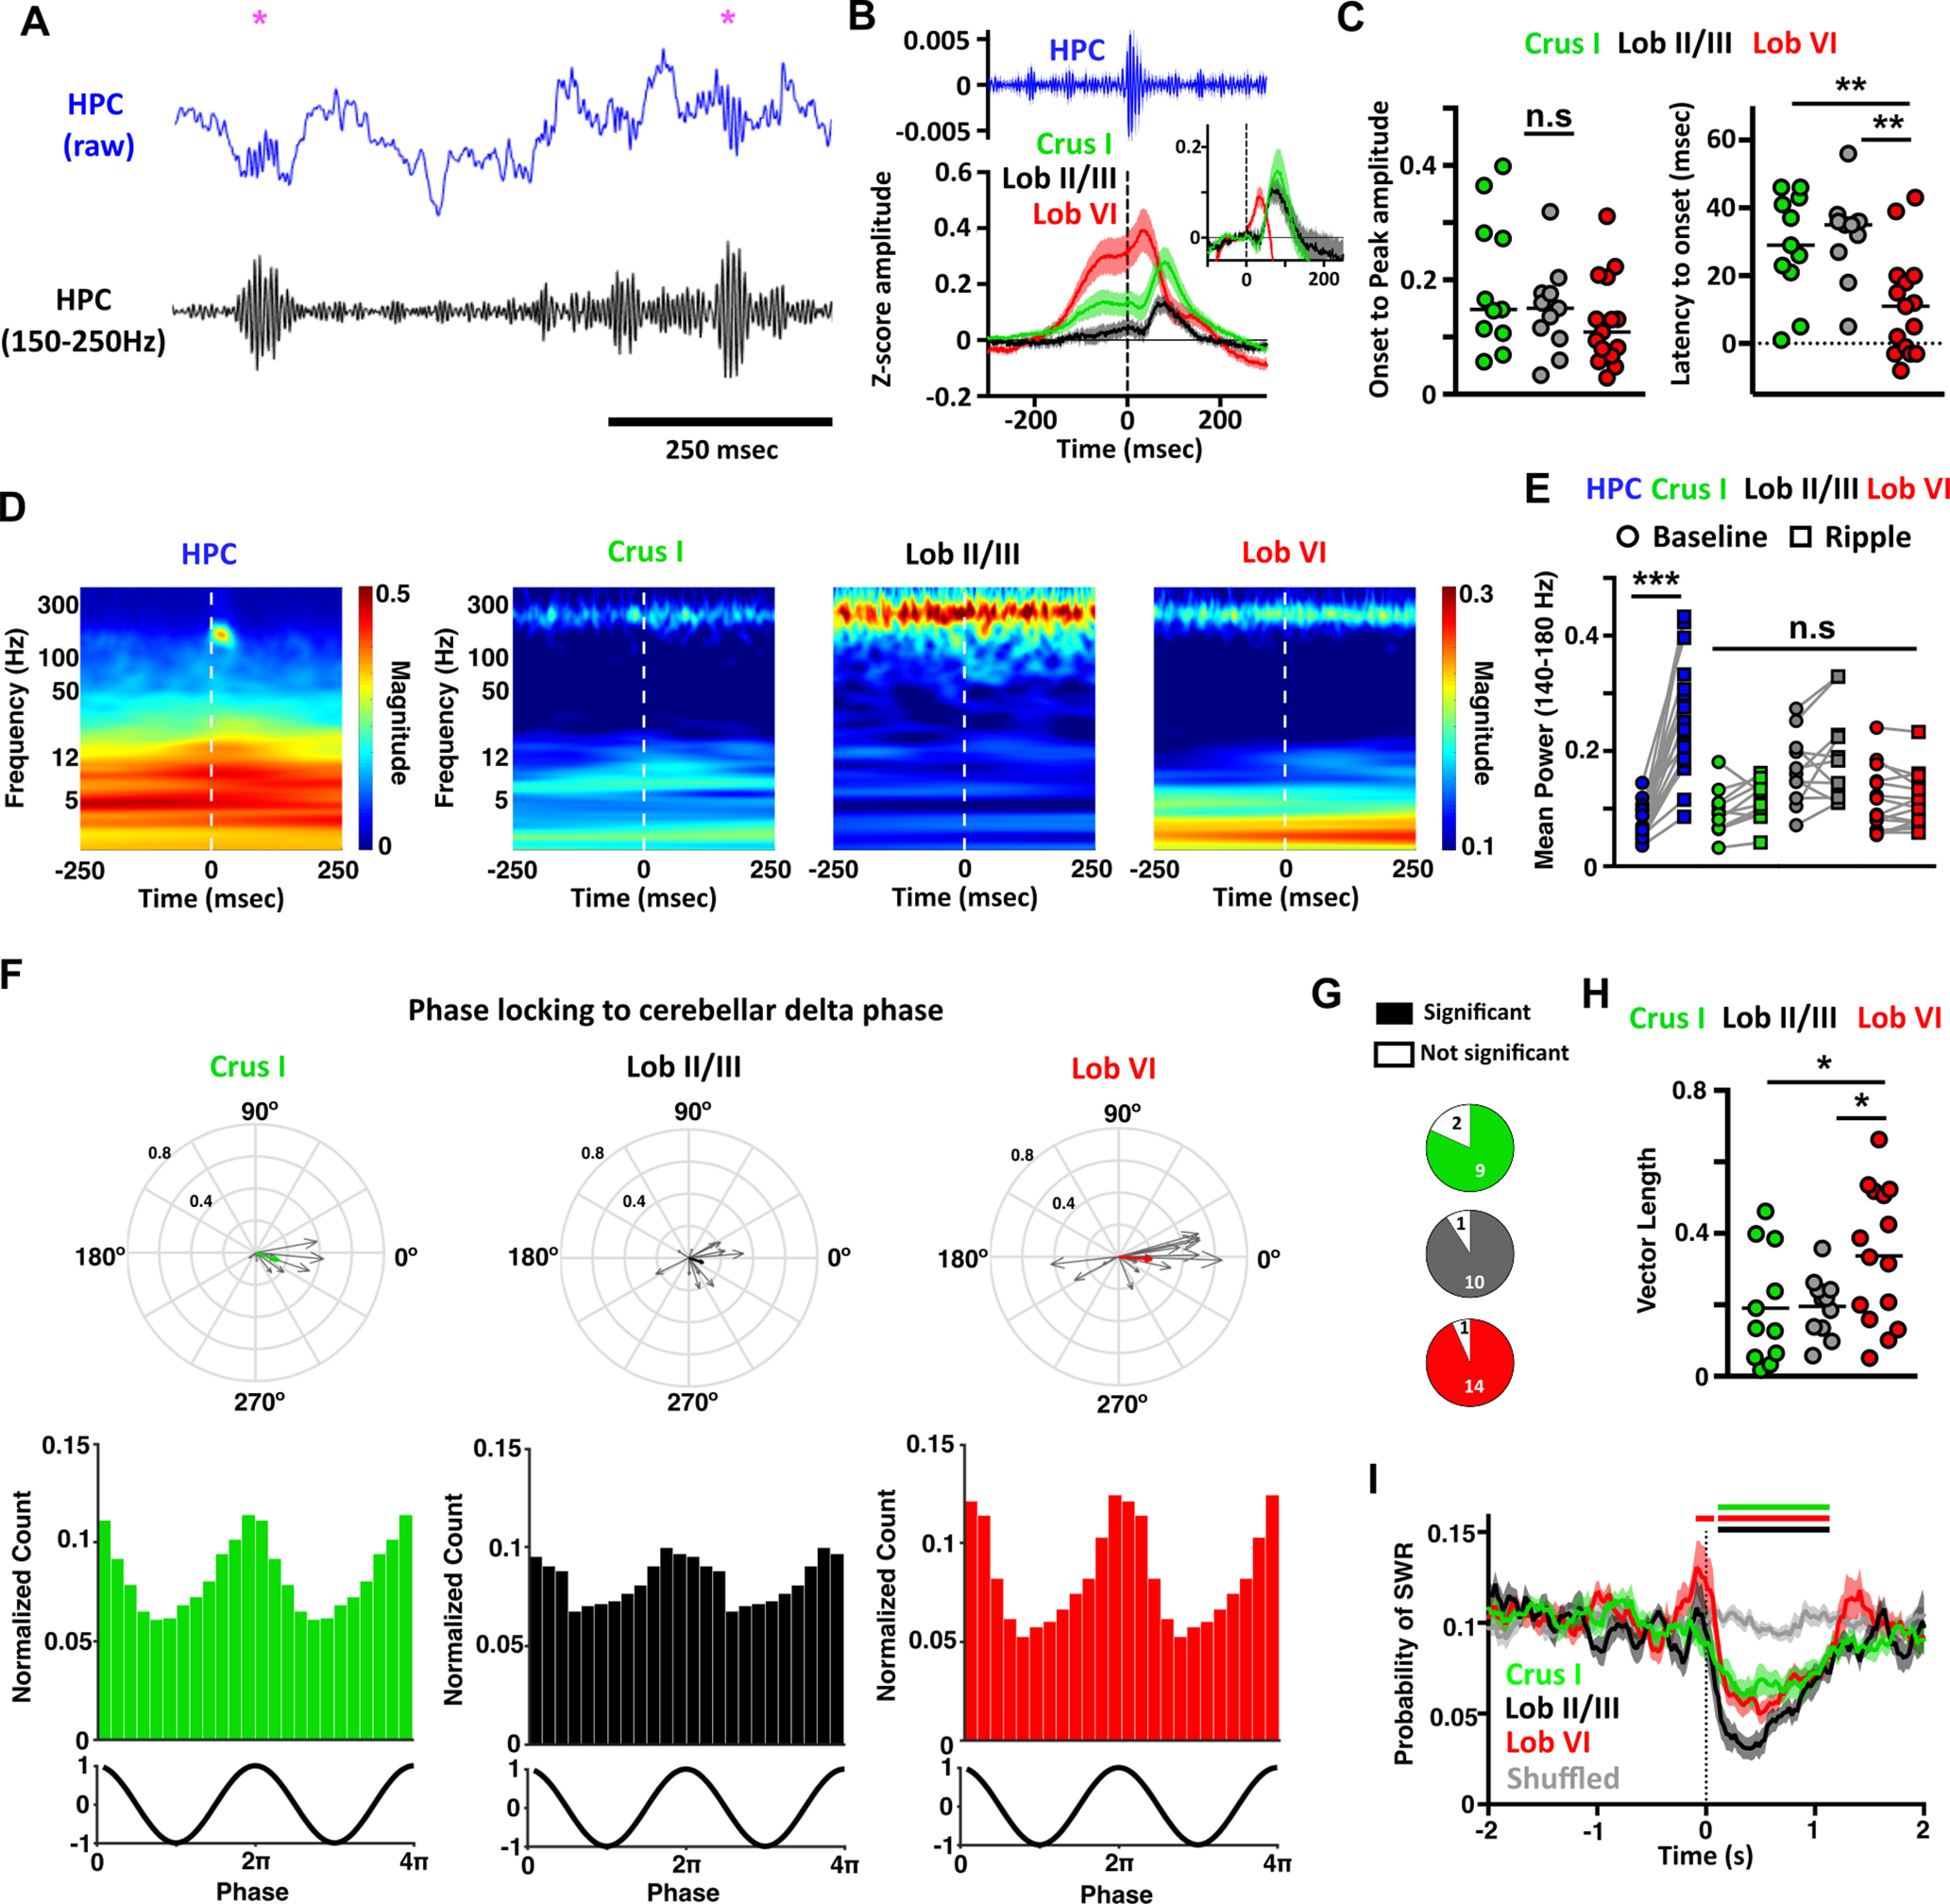
Figure 7.

Hippocampal SWRs trigger evoked activity in the cerebellum, and cerebellar PSP events reduce probability of hippocampal SWR occurrence. A, Example of the raw (blue) and filtered (150-250 Hz, black) hippocampal LFP during non-REM sleep. SWRs were identified (purple asterisks) at the maximal value in the filtered signal. B, Averaged SWR-triggered waveforms from the cerebellar recordings. Zero time represents the time of detected SWR onset in the filtered signal. Evoked field potentials were observed in all the cerebellar recordings. Inset, The same data but baselined against values from −100 to −50 ms, eliminating the slow-frequency component and allowing clearer visualization of the evoked potentials. C, From the baseline normalized data, we quantified the ERP amplitude measured as the onset-to-peak value and also the onset latency. No significant differences were observed for amplitude; however, Lob VI ERPs occurred at significantly shorter latencies compared with both Lob II/III and Crus I. D, Averaged power spectra triggered by detected hippocampal SWR events (time 0). We observe discrete SWR activity in the hippocampal spectrogram (∼150 Hz) that is not present in the cerebellum. E, Mean spectral power in the 140-180 Hz range calculated in windows of 250 ms pre- and post-detected SWR onset. Significant increases in this frequency range were only detected in hippocampal signals. F, Significant phase-locking of SWRs to δ oscillations was found in all cerebellar regions during non-REM sleep. Bottom panels, The normalized count of PSPs recorded at the different phases of δ oscillations in all mice for each cerebellar region. Top, The individual vectors of the phase-locking for each mouse (gray arrows) and the average vector across all mice (color-coded; resultant vector angle: Crus I = 341.53°, Lob II = 342.10°, Lob VI = 355.27°; resultant vector length: Crus I = 0.16, Lob II = 0.1, Lob VI = 0.21). G, Fraction of mice with significant SWR-to-cerebellar δ phase-locking (significant phase-locking was found in Crus I, 9/11 mice; Lob II/III, 10/11 mice; Lob VI 14/15 mice). H, The level of SWR phase-locking was higher with Lob VI compared with Crus I or Lob II/III. I, Probability of SWRs relative to PSP onset. The number of SWRs are reduced following PSP occurrence. Color bars represent significant differences in PSP probability relative to shuffled data (Lob VI, red; Crus I, green; Lob II/III, black; two-way ANOVA with multiple comparisons between cerebellar region and shuffled data). For all mean plots, HPC, n = 20 mice; Crus 1, n = 11 mice; Lob II/III, n = 11 mice; Lob VI, n = 15 mice. For detailed statistical comparisons, see Extended Data Figure 2-1. *p < 0.05. **p < 0.01. ***p < 0.001.
