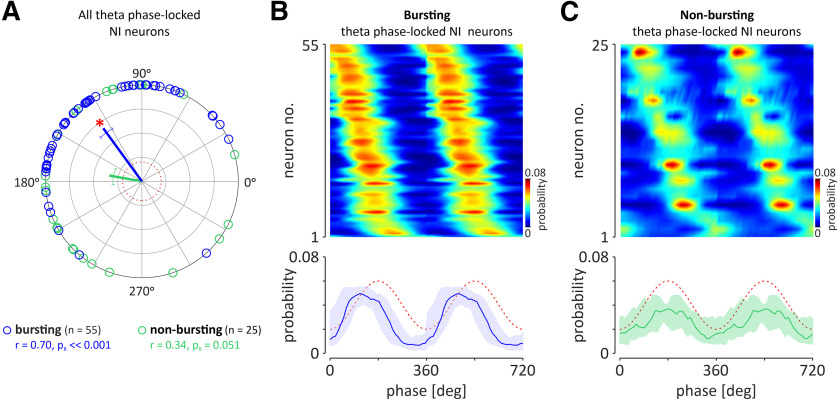
Figure 4.
The preference of nonbursting and bursting, theta phase-locked NI neurons to fire action potentials at a specific phase of the hippocampal theta oscillation. A, Circular plot illustrating the phase preference of individual bursting (blue; n = 55) and nonbursting (green; n = 25) neurons. Solid lines indicate the mean direction vector of a specific neuronal population (coded by color). Whiskers represent circular SEM directions. The red, dotted circle indicates the length of the direction vector equal to 0.2. Red asterisk, Significant phase preference of the population of theta bursting NI neurons; r, direction vector length; pR, confidence level of Rayleigh's test for uniformity. A, B, Heat maps of the probability to fire action potentials at a specific hippocampal theta phase for theta phase-locked bursting (B) and theta phase-locked nonbursting (C) neurons. The neurons are sorted according to the phase of the probability peak. Bottom, The median (blue and green lines) phase preference of the two groups of NI neurons shown above. Light-colored area, interquartile range; red-dashed line, idealized hippocampal theta oscillations. The trough of the hippocampal theta rhythm was defined as the zero phase.

