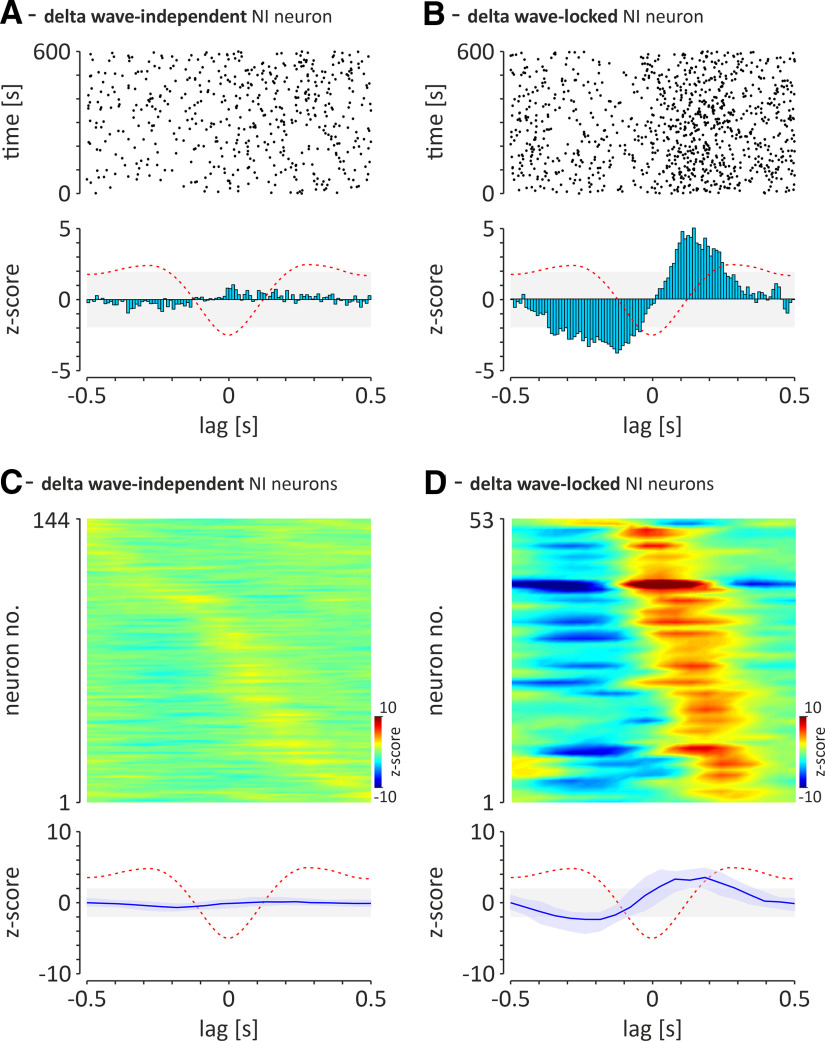
Figure 7.
Two types of NI neurons that can be distinguished on the basis of their preference to fire action potentials in a hippocampal delta wave-independent or delta wave-locked manner. A, An exemplary NI neuron that fires action potentials in a delta wave-independent manner (peak z score of delta wave zero-phase-triggered PSTH < 1.96). B, An exemplary neuron with strong preference to fire in a hippocampal delta wave-locked manner (peak z score of delta wave zero phase-triggered PSTH peak, ≥1.96). Top, Scatter plots illustrating the position of individual action potentials (dots) around the delta wave-negative peak. Bottom, Histograms illustrating the distribution of action potential firing around the delta wave-negative peak. The red-dashed line, Idealized hippocampal delta waves; light gray area indicates the range of non-significant z score values (range, ±1.96; equivalent to ±95% confidence limits). Bins, 10 ms. C, D, The relationship between firing of all recorded delta wave-independent (C) and delta wave-locked (D) NI neurons and the negative peak of hippocampal CA1 delta waves. Top, Heat maps illustrating z-score values of delta wave zero phase-triggered PSTH (10 ms bins) for delta wave-independent (C; n = 144) and delta wave-locked (D; n = 53) neurons. The z score values are color coded. Neurons are sorted according to the time of the z-value peak. Bottom, The median (blue line) delta wave zero phase-triggered PSTH of the two groups of NI neurons shown above. Light blue area, interquartile range; red-dashed line, illustration of idealized hippocampal delta wave.

