Figure 1.

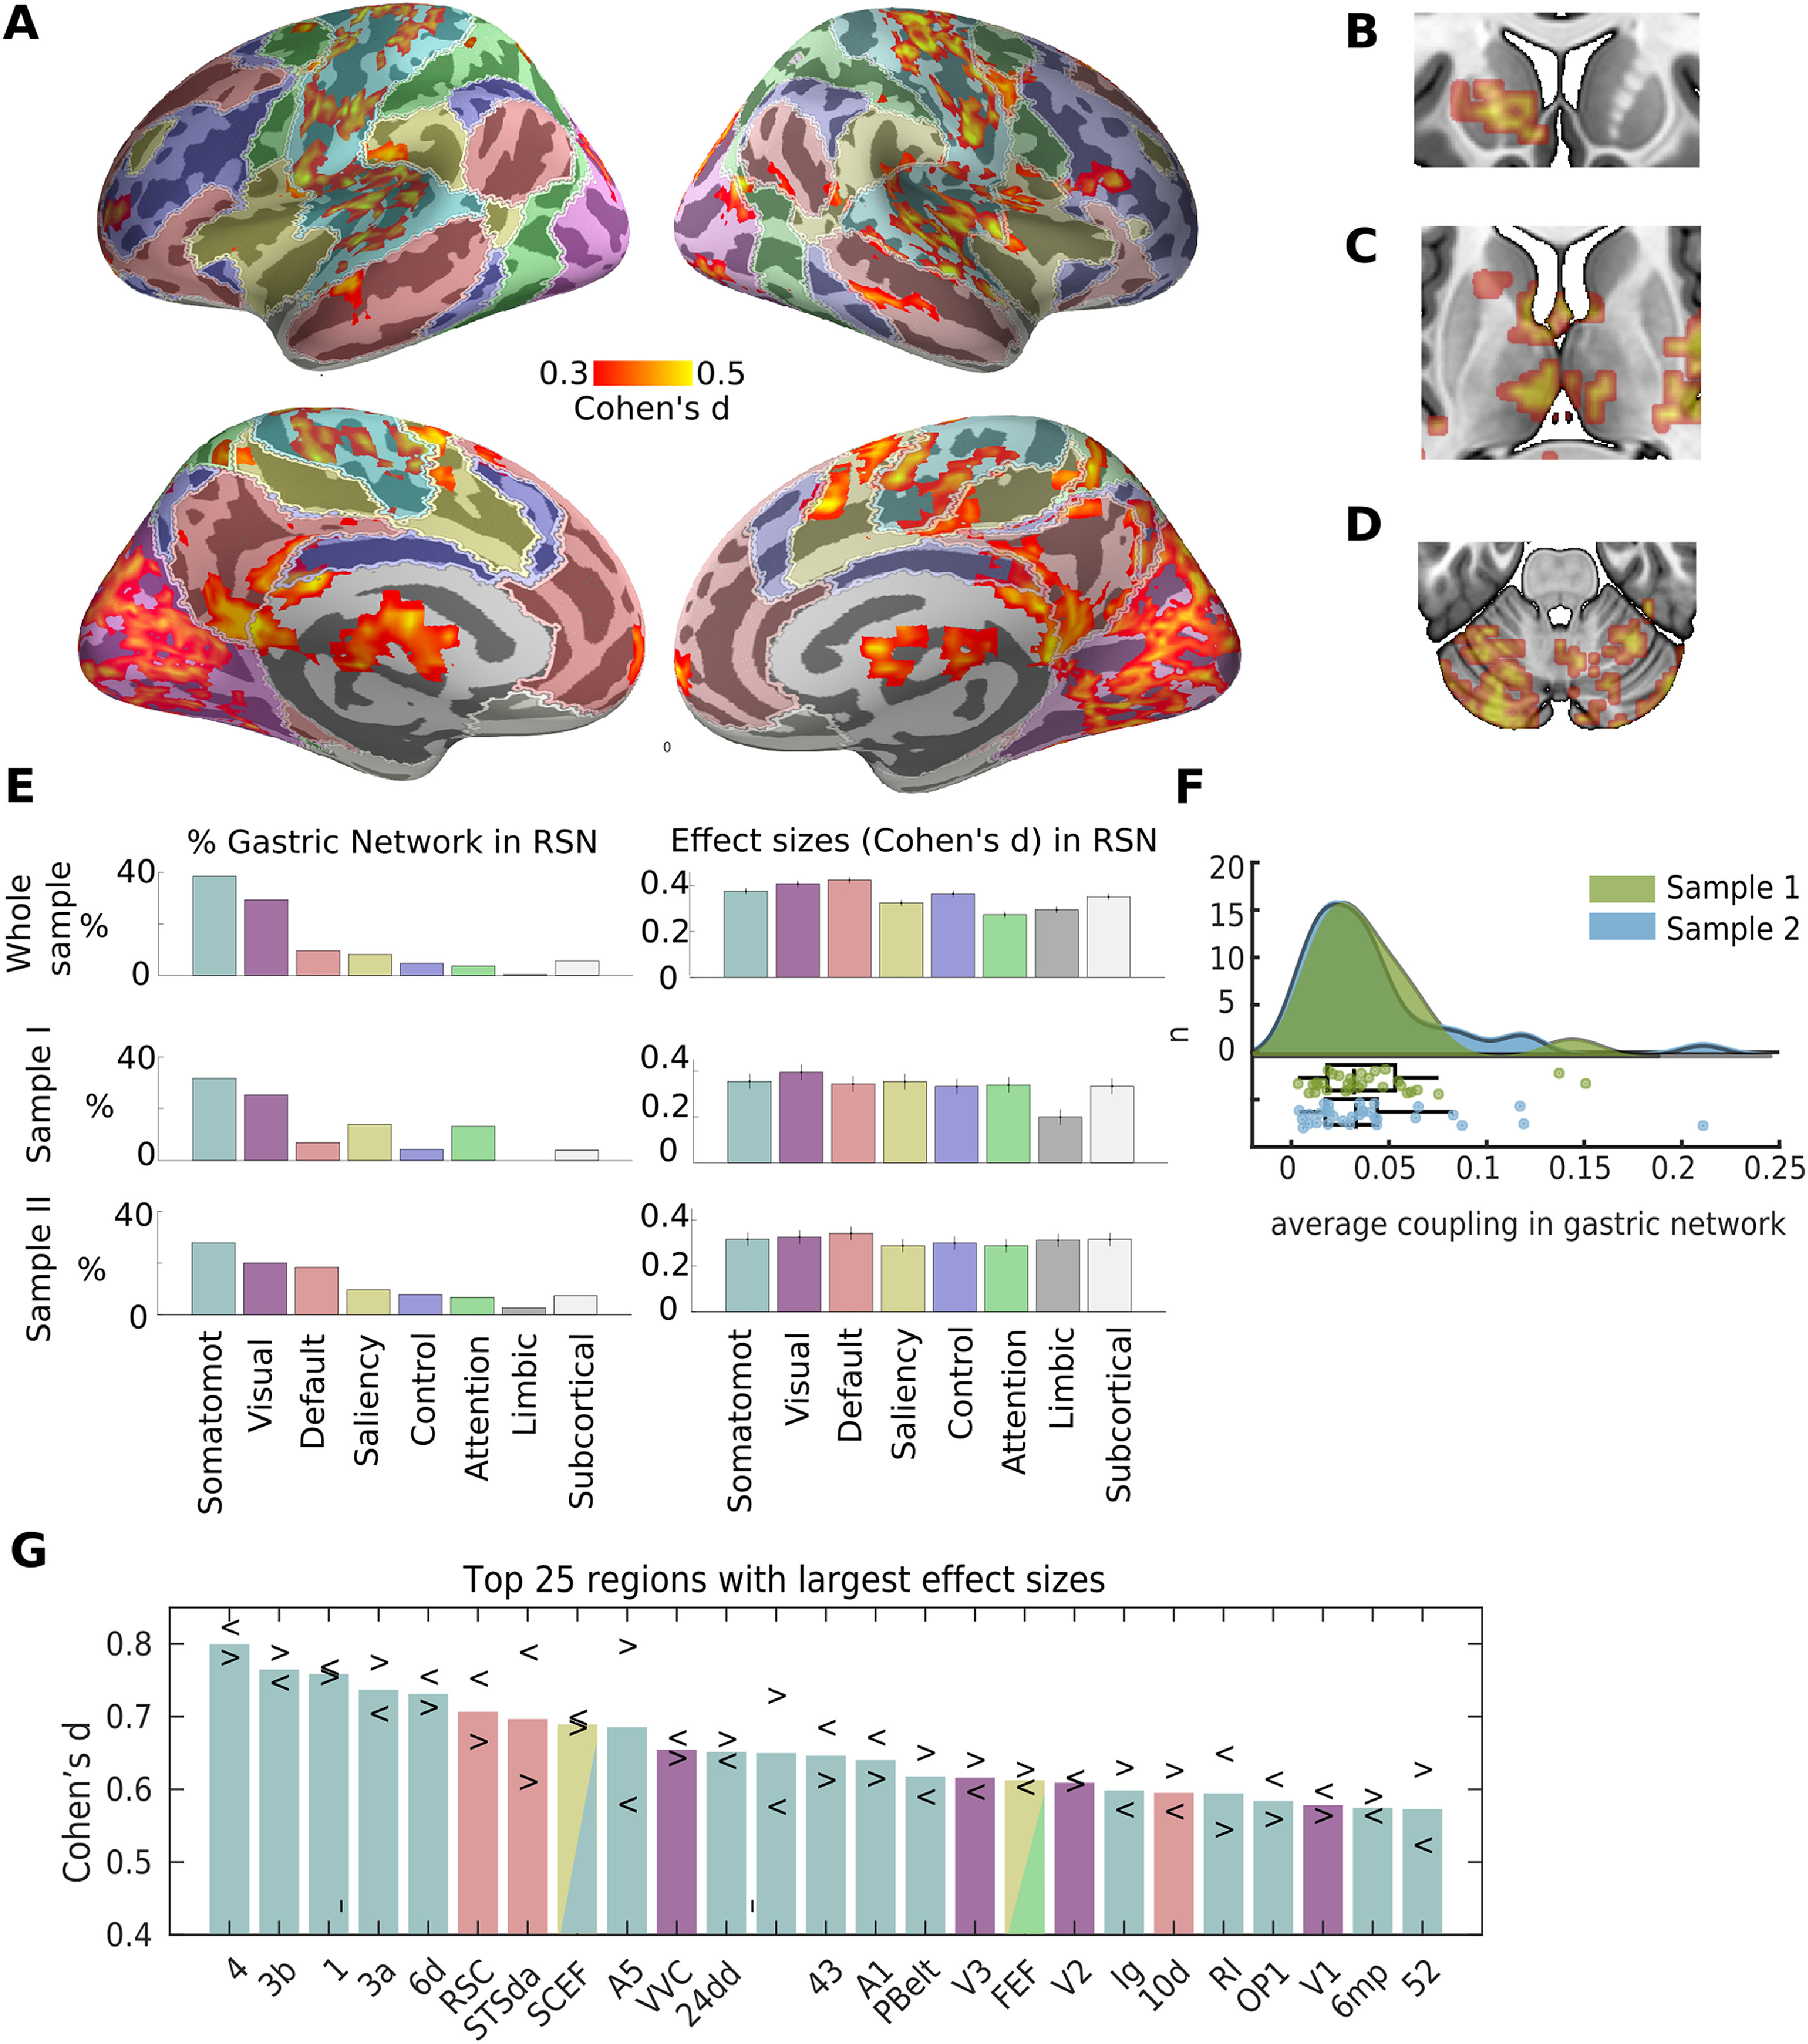
The gastric network and RSNs. A, Effect sizes (Cohen's d) of gastric-BOLD coupling are plotted in orange in regions significantly phase synchronized to the gastric rhythm (n = 63, voxel-level threshold = 0.05 one-sided and cluster significance <0.025 one-sided, intrinsically corrected for multiple comparisons), overlaid on top of the cortical parcellation in seven RSNs proposed by (Yeo et al., 2011), color codes as in E. The gastric network also comprises left striatum (B), bilateral thalamus (C), and cerebellum (D). E, Percentage of the gastric network in each of the brain's RSNs (left), and average effect size across significant voxels within each network (right) for the whole sample (top), sample 1 (n = 29, middle), and sample 2 (n = 34, bottom). Error bars represent the standard error of the mean, and were obtained through a bootstrapping procedure. Note that in the Yeo et al. (2011) parcellation, subcortical refers to thalamus and striatum but does not include cerebellum. F, Average coupling in the gastric networks across participants, green sample 1, blue sample 2. The points of the boxplot represent individual participants. G, Twenty-five regions from Glasser et al. (2016) parcellation showing the largest effect sizes averaged across hemispheres. Arrowheads depict effect sizes for left (<) and right (>) hemispheres. Somatomot, somato-motor-auditory. Tables in Extended Data Figures 1-1, 1-2 contain the t values peak coordinates in MNI space and the effect sizes in each region of the Glasser et al. (2016) parcellation, respectively.
