Figure 2.

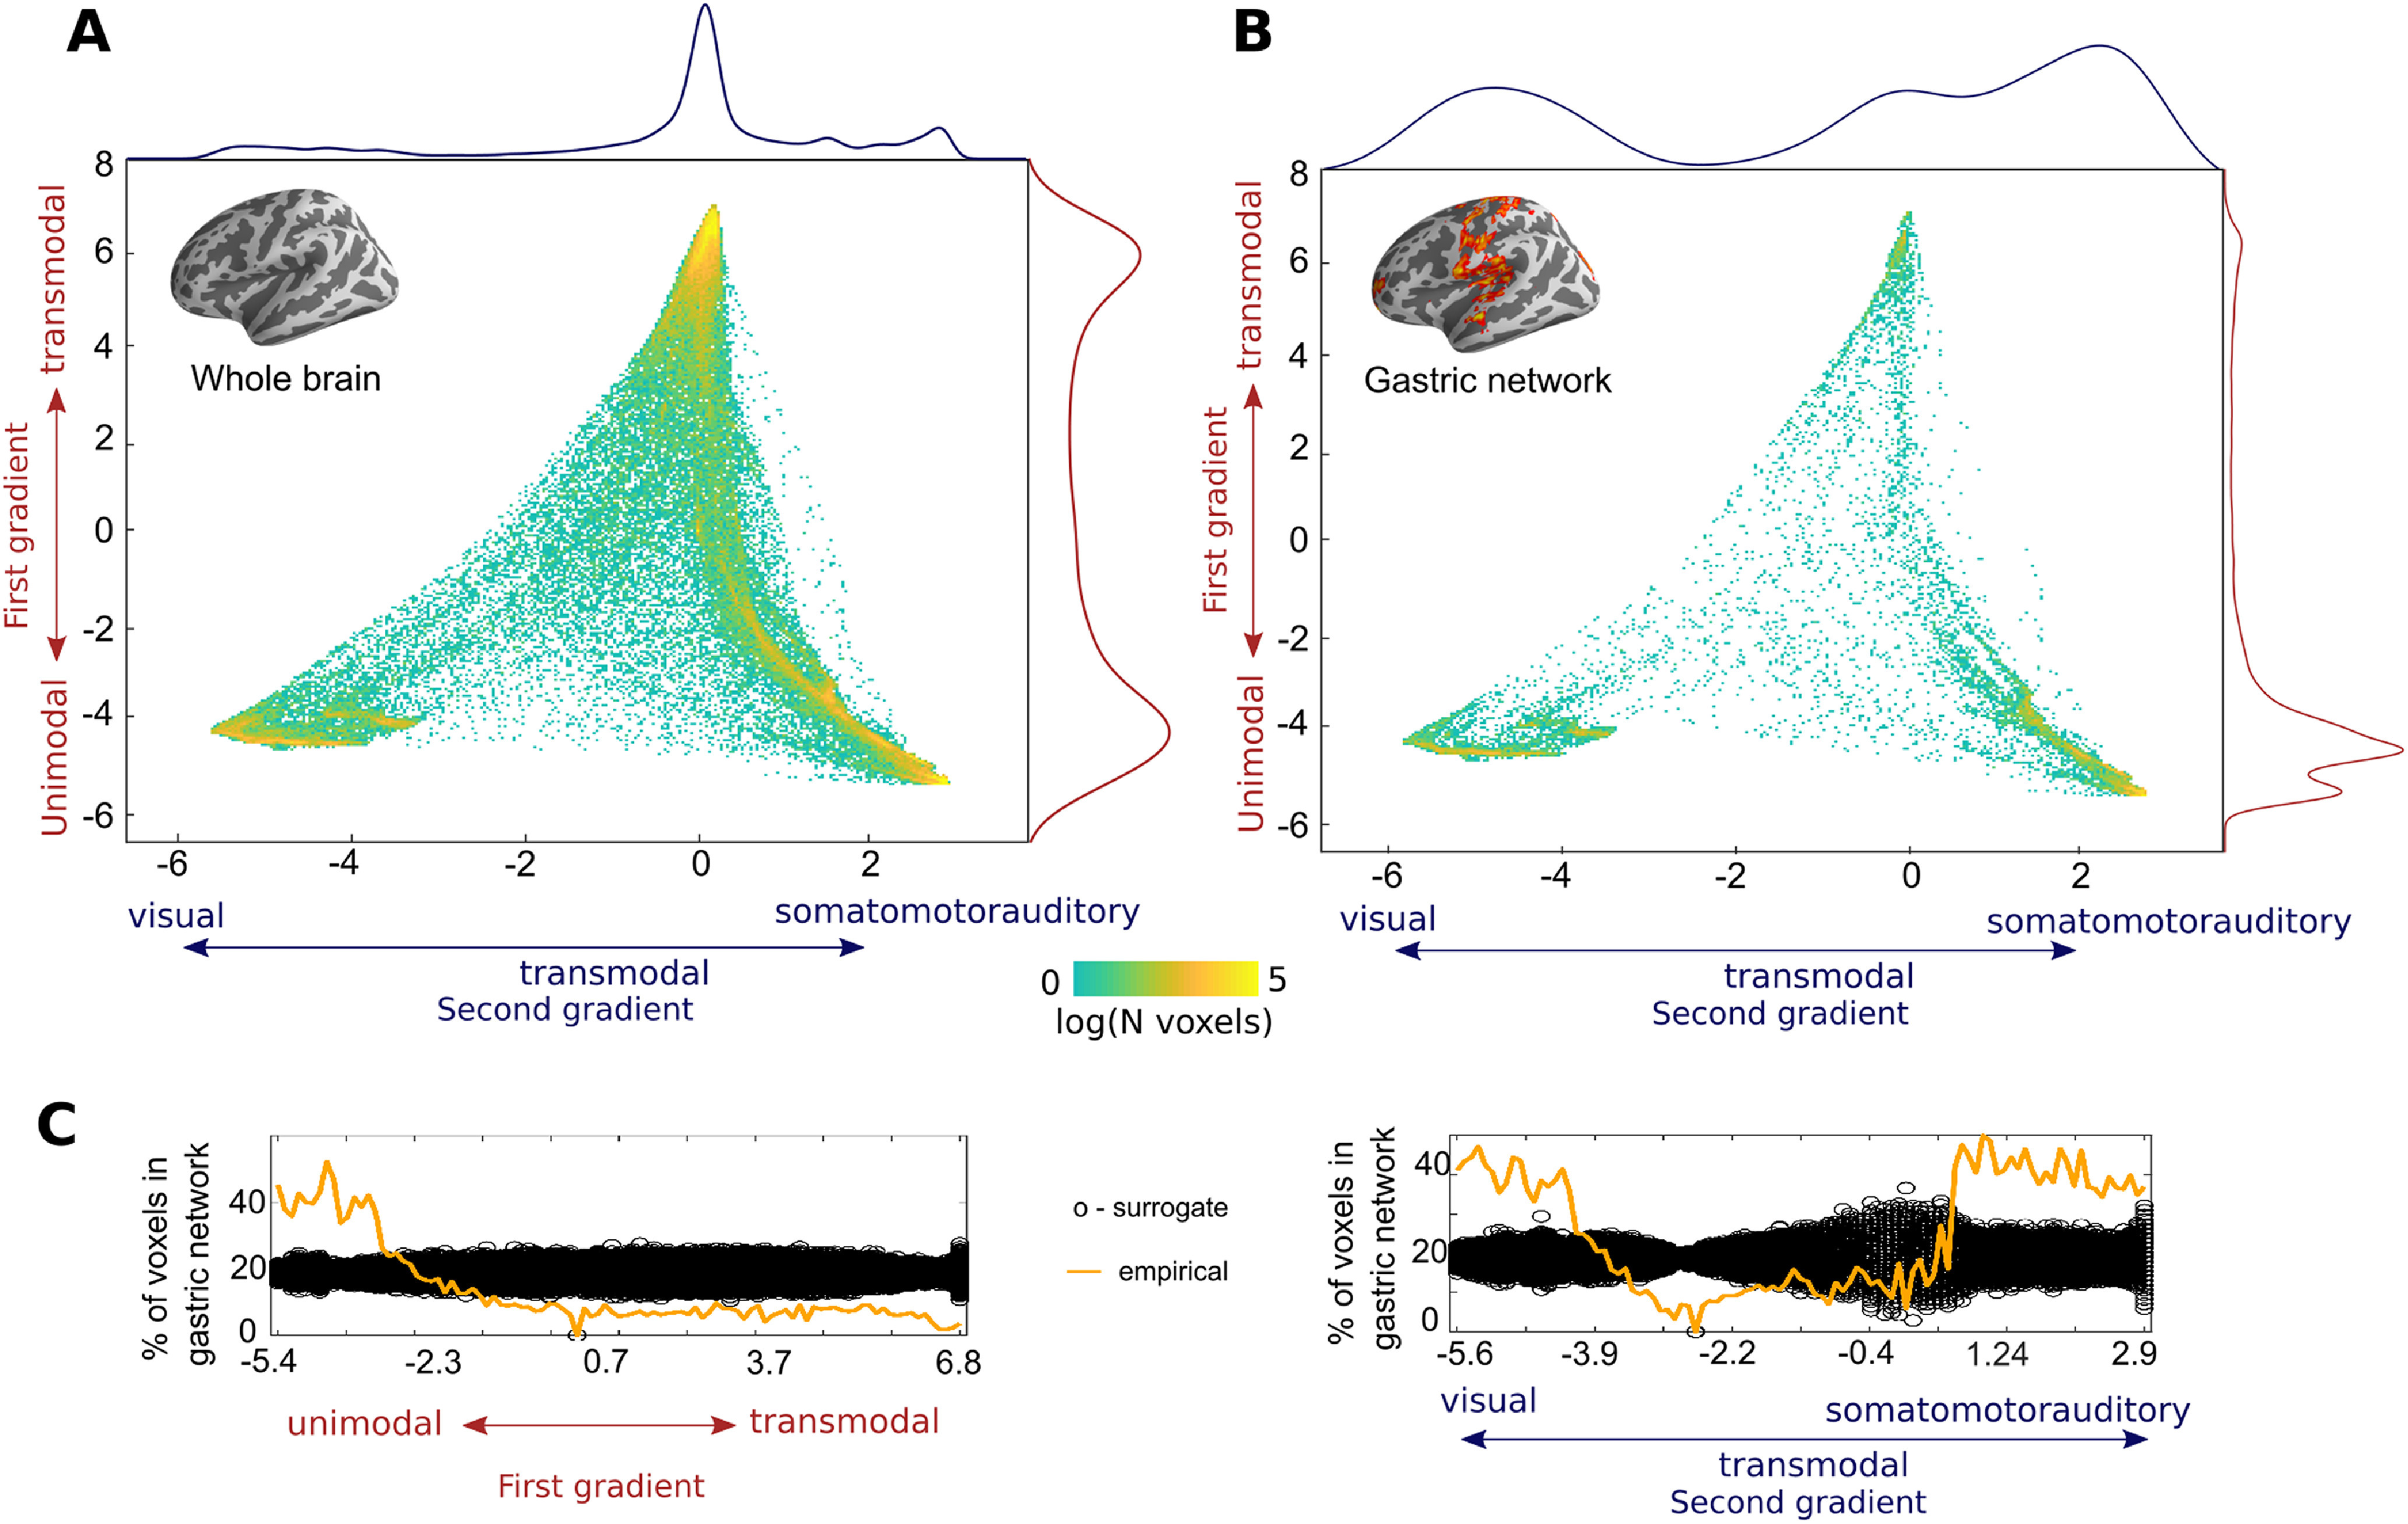
The gastric network and cortical gradients of functional connectivity. A, Density plot depicting the distribution of all cortical voxels along the first two gradients of functional connectivity described previously (Margulies et al., 2016). The first gradient (y-axis), runs from unimodal (negative values, sensory or motor regions) to transmodal regions (positive values). The second gradient (x-axis) runs from visual (positive values) to somato-motor and auditory regions (negative values). The color scale depicts the logarithm of the number of voxels. The projection of the probability density on the first and second gradients are shown in red and blue, respectively. B, Density plot of gastric network voxels on the first two gradients of functional connectivity. Gastric network voxels are located in the unimodal extremes of the two gradients. The projection of the probability density on the first and second gradients are shown in red and blue, respectively. C, Percentage of all brain voxels that belong to the gastric network (orange) for each of the two gradients, computed on 100 equidistant bins. The black circles depict the distribution of chance level overlap obtained by reallocating randomly the spatial position of gastric network voxels in the cortex. Gradients downloaded from https://identifiers.org/neurovault.collection:1598.
