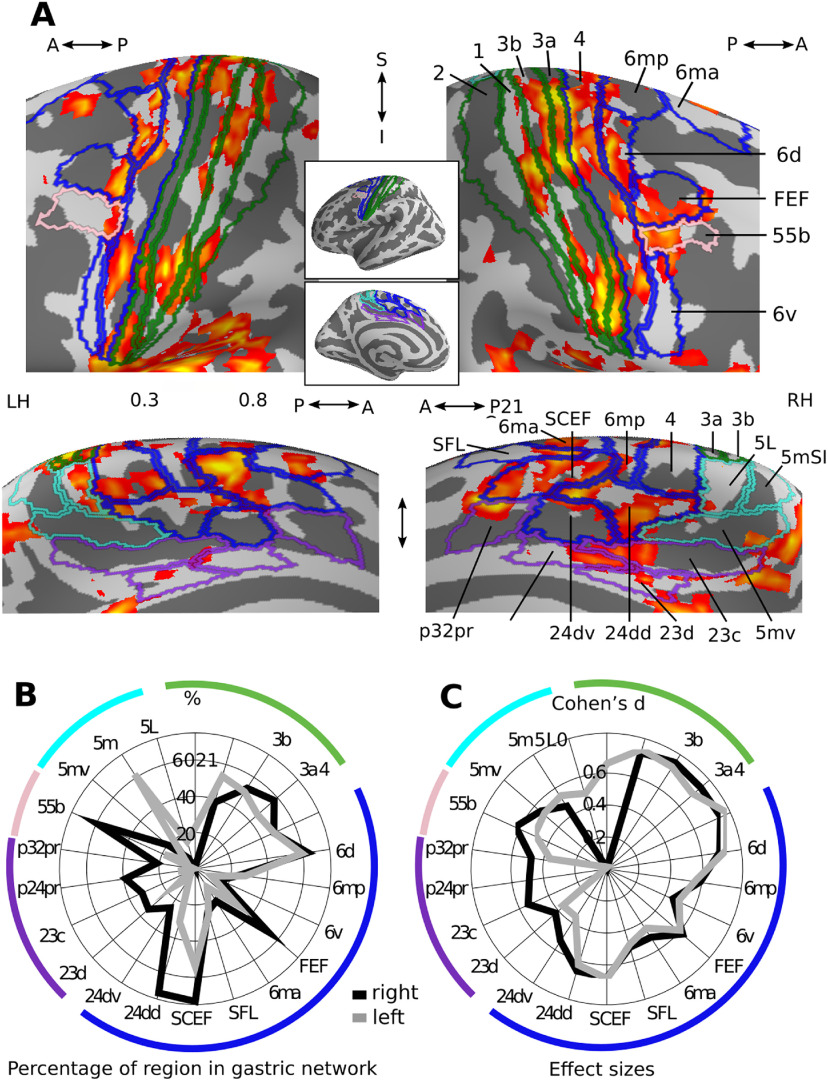
Figure 3.
Gastric network in central and mid-cingulate regions. A, Effect sizes in the gastric network in central (top) and mid-cingulate regions (bottom) displayed on the left and right inflated surfaces and overlaid with the corresponding regions of Glasser et al. (2016) parcellation. Green, primary somatosensory; blue, motor and premotor regions; pink, area 55b; violet, nonmotor cingulate regions; cyan, area 5 and its subdivisions. B, Percentage of each region overlapping with the gastric network. C, Effect sizes of gastric-BOLD coupling in voxels belonging to the gastric network split by regions. A, Anterior; I, Inferior; LH, Left hemisphere; P, posterior; RH, Right hemisphere; S, Superior. Area names as in text and Extended Data Figure 1-2.

