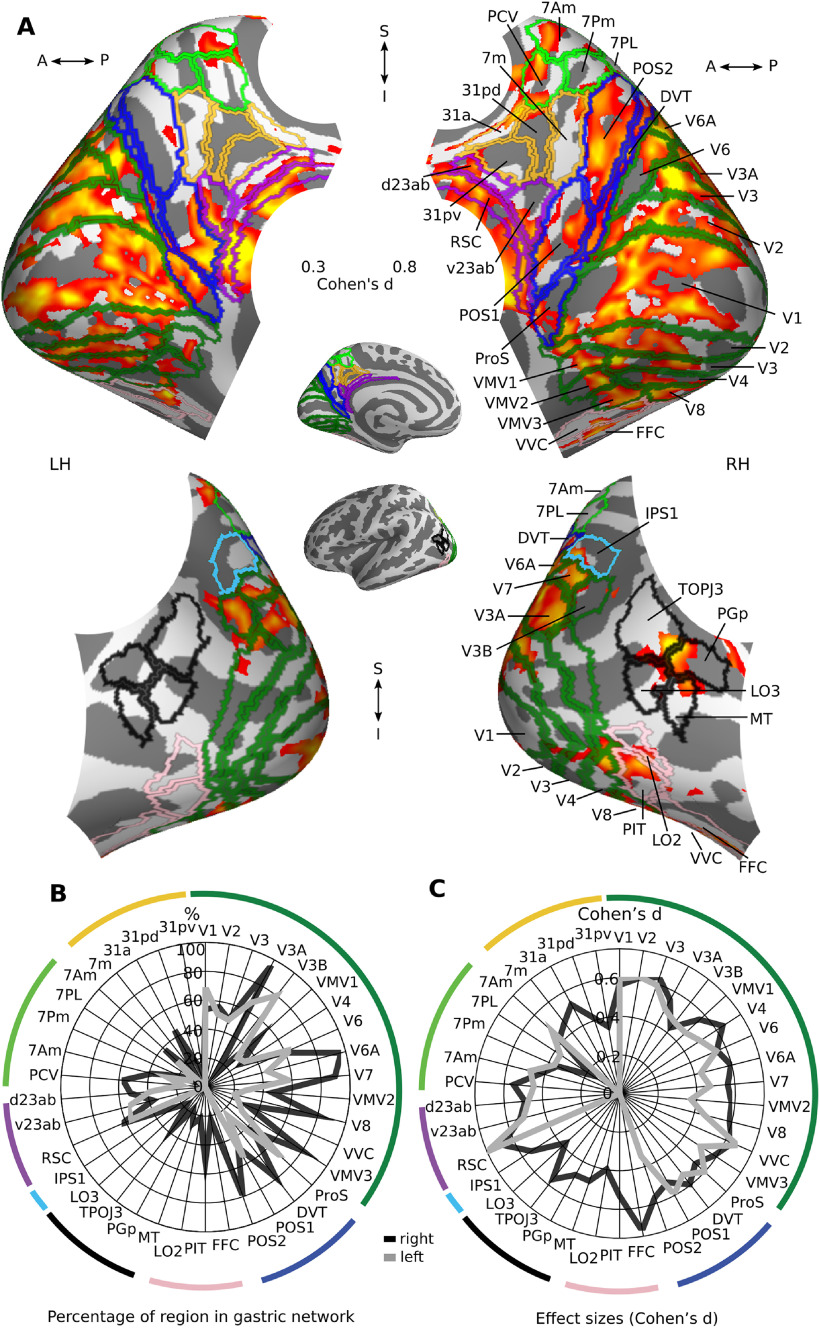
Figure 5.
Gastric network in posterior regions. A, Medial (top) and lateral (bottom) views of effect sizes in the gastric network in left and right posterior regions, displayed on inflated cortical surfaces and overlaid with the corresponding regions of Glasser et al. (2016) parcellation. Dark green, early visual; blue, occipito-parietal sulcus; violet, retrosplenial and posterior cingulate cortices; yellow, ventral precuneus; light green, dorsal precuneus; black, temporo-parietal-occipital junction; pink, lateral occipital and fusiform. B, Percentage of voxels belonging to the gastric network, in each region. C, Effect sizes of gastric-BOLD coupling in voxels belonging to the gastric network split by regions. A, Anterior; I, Inferior; LH, Left hemisphere; P, posterior; RH, Right hemisphere; S, Superior. Area names as in text and Extended Data Figure 1-2.

