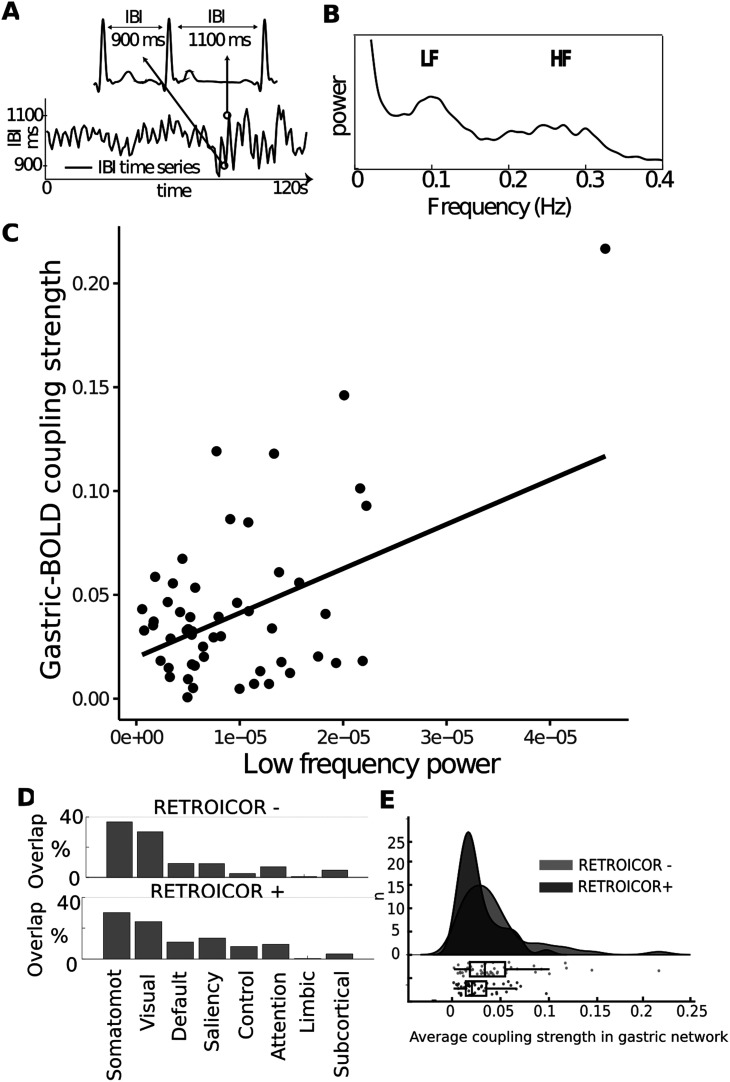
Figure 7.
Association between coupling strength and autonomic activity A, IBIs, or time difference between each heart-beat, are used to build time series of HRV. Reproduced from Azzalini et al. (2019). B, The power spectrum of HRV, displaying a prominent peak in the low-frequency band (LF; 0.05–0.15 Hz), reflecting both sympathetic and parasympathetic activity, and in the high-frequency band (HF; 0.16–0.25 Hz), reflecting parasympathetic activity. C, A robust linear regression shows a relationship between the average coupling strength in the gastric network and the LF-HRV (n = 52, t(50) = 3.76, robust regression, r2 = 0.22, uncorrected p = 0.0004, Bonferroni corrected p = 0.0048). D, Percentage of the gastric network in each of the brain's RSNs before (top) and after (bottom) correcting for cardiac timing using RETROICOR (Glover et al., 2000). E, Average coupling strength in the gastric network across 52 participants before and after RETROICOR. The points of the boxplot represent individual participants.

