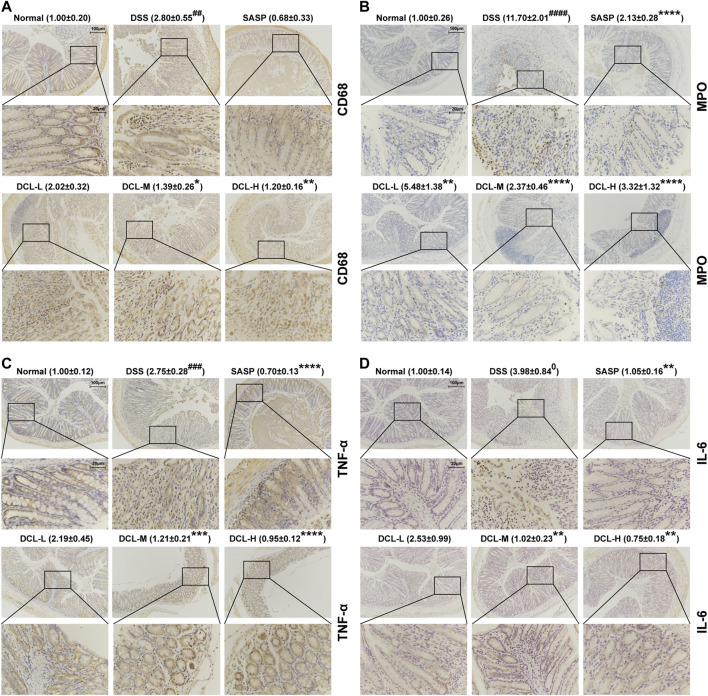
FIGURE 3.
DCL represses intestinal inflammation of DSS-induced colitis in mice. The representative immunohistochemical images and the relative expression of CD68 (A) and MPO (B) in colon tissues from each group. The effects of DCL on the expression of TNF-α (C) and IL-6 (D) in DSS- challenged mice. Scale bar = 20 and 100 μm. The brown areas indicate positive areas. Data are represented as mean ± SEM, n = 6. # p < 0.05, ## p < 0.01, ### p < 0.001, #### p < 0.0001 compared to normal group. * p < 0.05, ** p < 0.01, *** p < 0.001, **** p < 0.0001 compared to DSS group.

