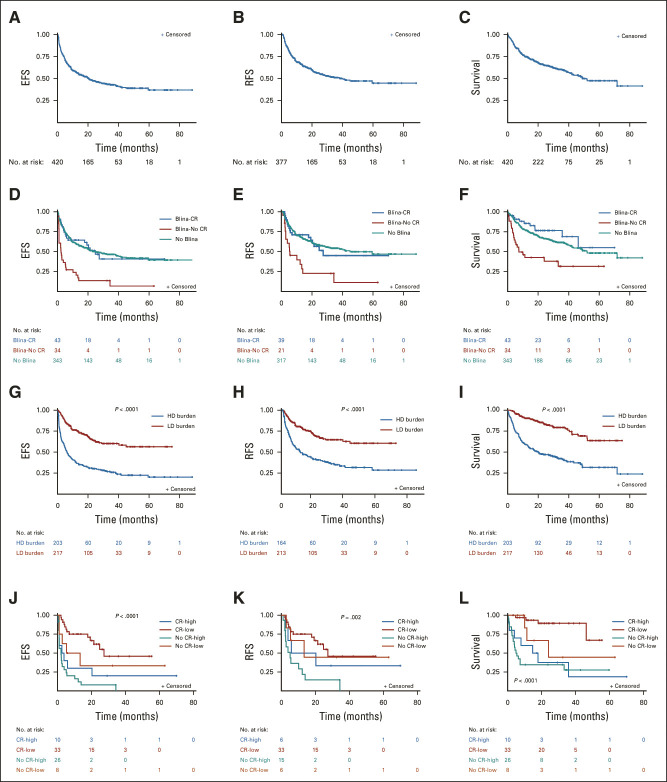
FIG 2.
EFS, RFS, and OS. (A-C Kaplan-Meier survival curves for all patients. (A) EFS, defined as the time from CD19-CAR infusion to one of the following events: no response, relapse, or death. (B) RFS, defined as the time from the first response to relapse or death. (C) OS, (D) EFS, (E) RFS, and (F) OS, stratified by blinatumomab-naïve patients (No Blina—teal) versus blinatumomab-exposed and achieved CR to Blina (Blina-CR—blue) versus blinatumomab-exposed and did not achieve a CR to Blina (Blina-No CR—red). P values for EFS curve: .59 (No Blina v Blina-CR); .01 (Blina-CR v Blina-No CR); .0001 (No Blina v Blina-No CR). P values for RFS curve: .70 (No Blina v Blina-CR); .0004 (Blina-CR v Blina-No CR); < .0001 (No Blina v Blina-No CR). P values for OS curve: .97 (No Blina v Blina-CR); < .0001 (Blina-CR v Blina-No CR); < .0001 (No Blina v Blina-No CR). (G) EFS, (H) RFS, and (I) OS, stratified by high-disease burden (≥ 5% bone marrow blasts—blue [high]) versus low-disease burden (< 5% bone marrow blasts—red [low]). (J) EFS, (K) RFS, and (L) OS, restricted to blinatumomab-exposed patients only, stratified by blinatumomab exposure, blinatumomab response, and disease burden (high-disease burden [≥ 5% bone marrow blasts] v low-disease burden [< 5% bone marrow blasts]). Blina-CR-low—red; Blina-CR-high—blue; Blina-No CR-low—brown; Blina-No CR-high—teal. P value shown represents the global P value. Blina, blinatumomab; CAR, chimeric antigen receptor; CR, complete remission; EFS, event-free survival; HD, high disease; high, high-disease burden; LD, low disease; low, low-disease burden; OS, overall survival; RFS, relapse-free survival.

