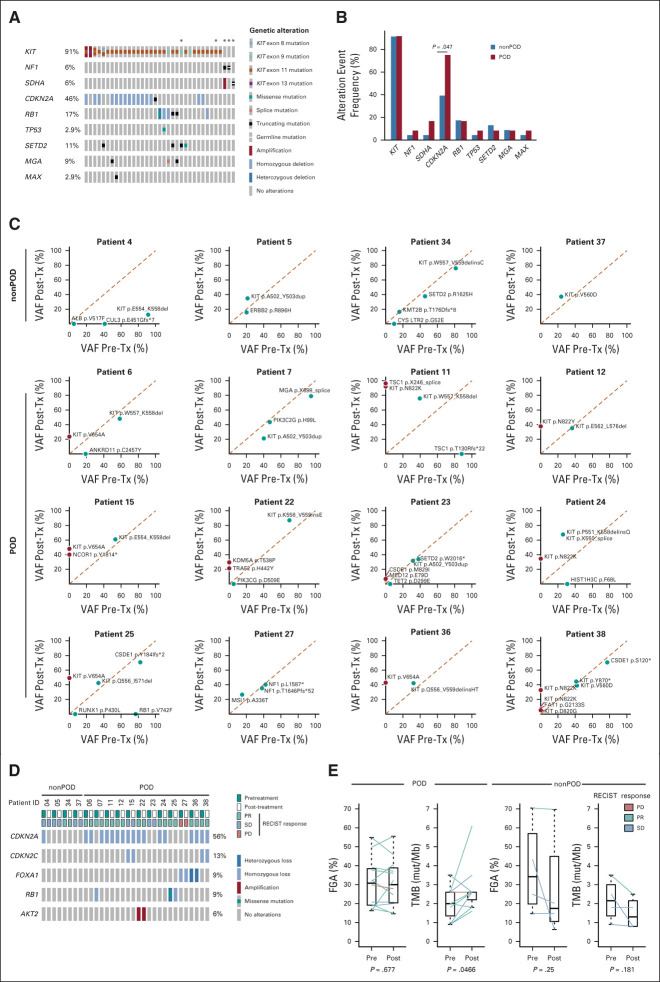
FIG 5.
Genomic analysis of resistant disease. (A) Oncogenic driver mutations and concurrent genetic alterations in pretreatment patient samples (n = 35). *Indicates patients who consented to germline testing. (B) Comparison of frequency of common genetic alteration events in pretreatment samples of patients who have progressed on imatinib and binimetinib combination treatment (POD, n = 12) and of those without disease progression (nonPOD, n = 23). P = .047 for CDKN2A by Fisher's exact test. Comparison of (C) VAF of mutation and (D) CNA of paired pretreatment and post-treatment biopsy samples from patients with (POD, n = 12) and without (nonPOD, n = 4) disease progression. (E) Comparison of FGA and TMB changes of paired pretreatment and post-treatment tumor samples from POD and nonPOD patients. P values were calculated using Student's paired-samples t-test. RECIST response: on the basis of best RECIST1.1 response. CNA, copy-number alteration; FGA, fraction of genome altered; nonPD, nonprogression of disease; PD, progression of disease; PR, partial response; SD, stable disease; TMB, tumor mutational burden; Tx, treatment; VAF, variant allele frequency.

