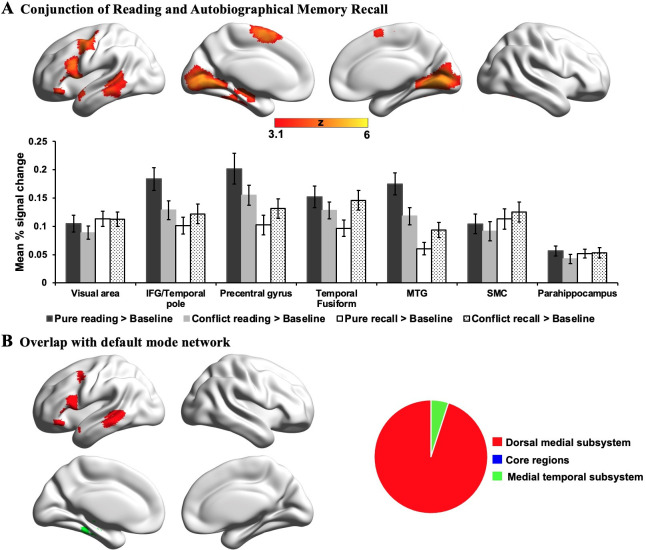
Appendix 1—figure 4. Conjunction analysis.
(A) Conjunction of brain activation during reading comprehension and autobiographical memory recall, with this conjunction identified using FSL’s ‘easythresh_conj’ tool. The bar chart shows the mean % signal change of each experimental condition over letter baseline in each identified cluster. Error bars represent the standard error. (B) The pie chart illustrates the percentages of voxels that were within the DMN in the task conjunction map that overlap with each DMN subsystem: the medial temporal subsystem is shown in green, and the dorsomedial subsystem is shown in red. The DMN conjunction largely fell within the dorsomedial subsystem of DMN. All maps were thresholded at z > 3.1 (cluster-size p-FWE <0.05). IFG = inferior frontal gyrus; MTG = middle temporal gyrus; SMC = supplementary motor cortex.

