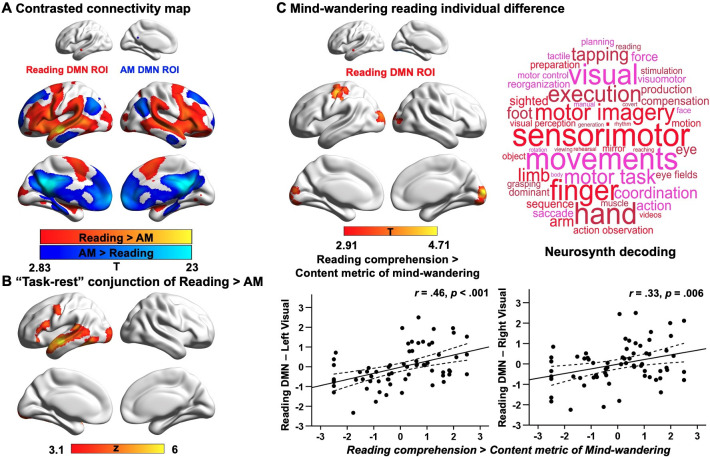
Appendix 1—figure 7. Results of resting-state intrinsic connectivity using a stringent motion criterion.
Panel (A) shows the results of a functional connectivity analysis examining differences between the DMN seeds (reading DMN MNI coordinates: − 56, -10, -12; autobiographical memory DMN MNI coordinates: − 6, -50, 22). Regions showing stronger intrinsic connectivity to the reading DMN seed are shown in warmer colours, while regions showing stronger intrinsic connectivity to the autobiographical memory DMN seed are shown in cooler colours. The lower panel (B) shows results of a formal conjunction between regions associated with greater activity during reading versus autobiographical memory retrieval, and regions showing stronger correlation at rest with the DMN seed most activated by reading. Panel (C) shows the relationship of these seeds’ functional architecture and self-reports of mind-wandering during reading. Group-level regression, using the DMN seed showing peak activation during reading, demonstrated stronger connectivity with the regions of primary visual areas and postcentral gyrus in individuals with good comprehension and less internally-generated mind-wandering content. The scatterplots present the correlation between behaviour and the average correlation with the reading-relevant DMN seed and the identified visual clusters (beta values). The error lines on the scatterplot indicate the 95% confidence estimates of the mean. Each point describes an individual participant. The word cloud shows the functional associations with this connectivity map using Neurosynth.

