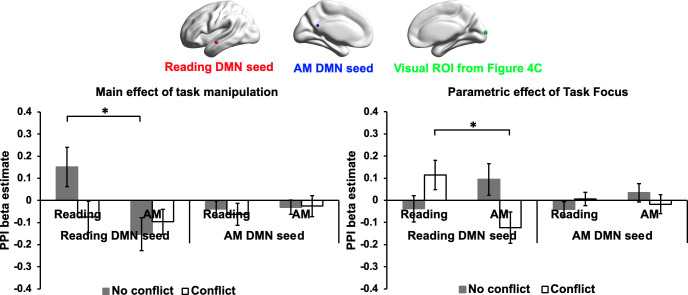
Figure 5. Results of task-based functional connectivity in visual ROI.
These plots present the functional connectivity in Experiment 1 of reading and autobiographical memory DMN seeds with a visual ROI that showed more decoupling for people with a propensity for mind-wandering while reading in Experiment 2 Dataset 2 (MNI coordinates: 8, -98, 8; identified in the contrast of Reading comprehension > Mind-wandering content in Figure 4C). The bar charts plot the mean PPI β values (i.e., representing the strength of functional connectivity between each DMN seed and the visual ROI). The left-hand graph shows the main effect of our task manipulation over the implicit baseline, while the right-hand graph shows the parametric effect of task focus for each experimental condition. Error bars depict the standard error of the mean. * indicates Bonferroni-corrected p value < 0.05.

