
Figure 5. Optogenetic inactivation of the POm during an active goal-directed task.
(A) Left, experimental design. The inhibitory opsin, archaerhodopsin (ArchT) was unilaterally injected into the POm and a fiber-optic cannula was chronically inserted into the brain. Right, localized ArchT spread in POm and fiber-optic track (dotted line), bar = 1 mm. POm was photoinactivated (590 nm, 5 mW, 2 s) either 500 ms prior to, and during the stimulus (S) and response (Rs) epochs (Stim/Resp), or during the reward epoch (Rw) in expert mice performing the ‘action’ goal-directed task. (B) Behavioral performance (d prime) for LED OFF vs LED ON during the stim/response epoch (n = 9 mice). Wilcoxon matched-pairs signed rank test. (C) z-Score during (left) HIT and (right) false alarm for LED OFF vs LED ON during the stim/response epoch (n = 9 mice). Wilcoxon matched-pairs signed rank test. (D) Latency to the first response lick in LED OFF vs LED ON during the stim/response epoch. Wilcoxon matched-pairs signed rank test. (E) Behavioral performance (d prime) during LED OFF and LED ON during the reward epoch in expert mice performing the ‘action’ goal-directed task (n = 5 mice). Wilcoxon matched-pairs signed rank test. (F) Normalized latency to the first response lick during LED ON in the stim/response epoch (solid) and reward (empty) epoch (normalized to the latency to the first lick during LED OFF). Line, median. Mann–Whitney test. Individual values are shown. *p < 0.05.
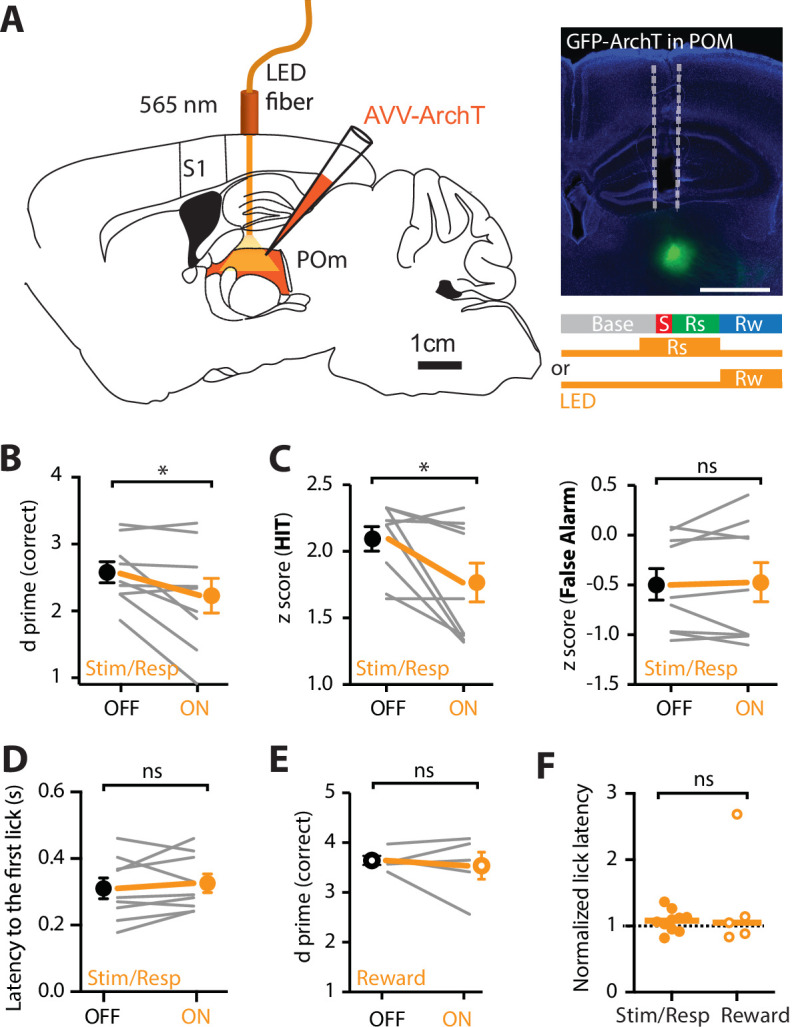
Figure 5—figure supplement 1. POm neurons are partially photoinhibited by 590 nm LED.

Figure 5—figure supplement 2. LED in POm does not alter goal-directed behavior.
