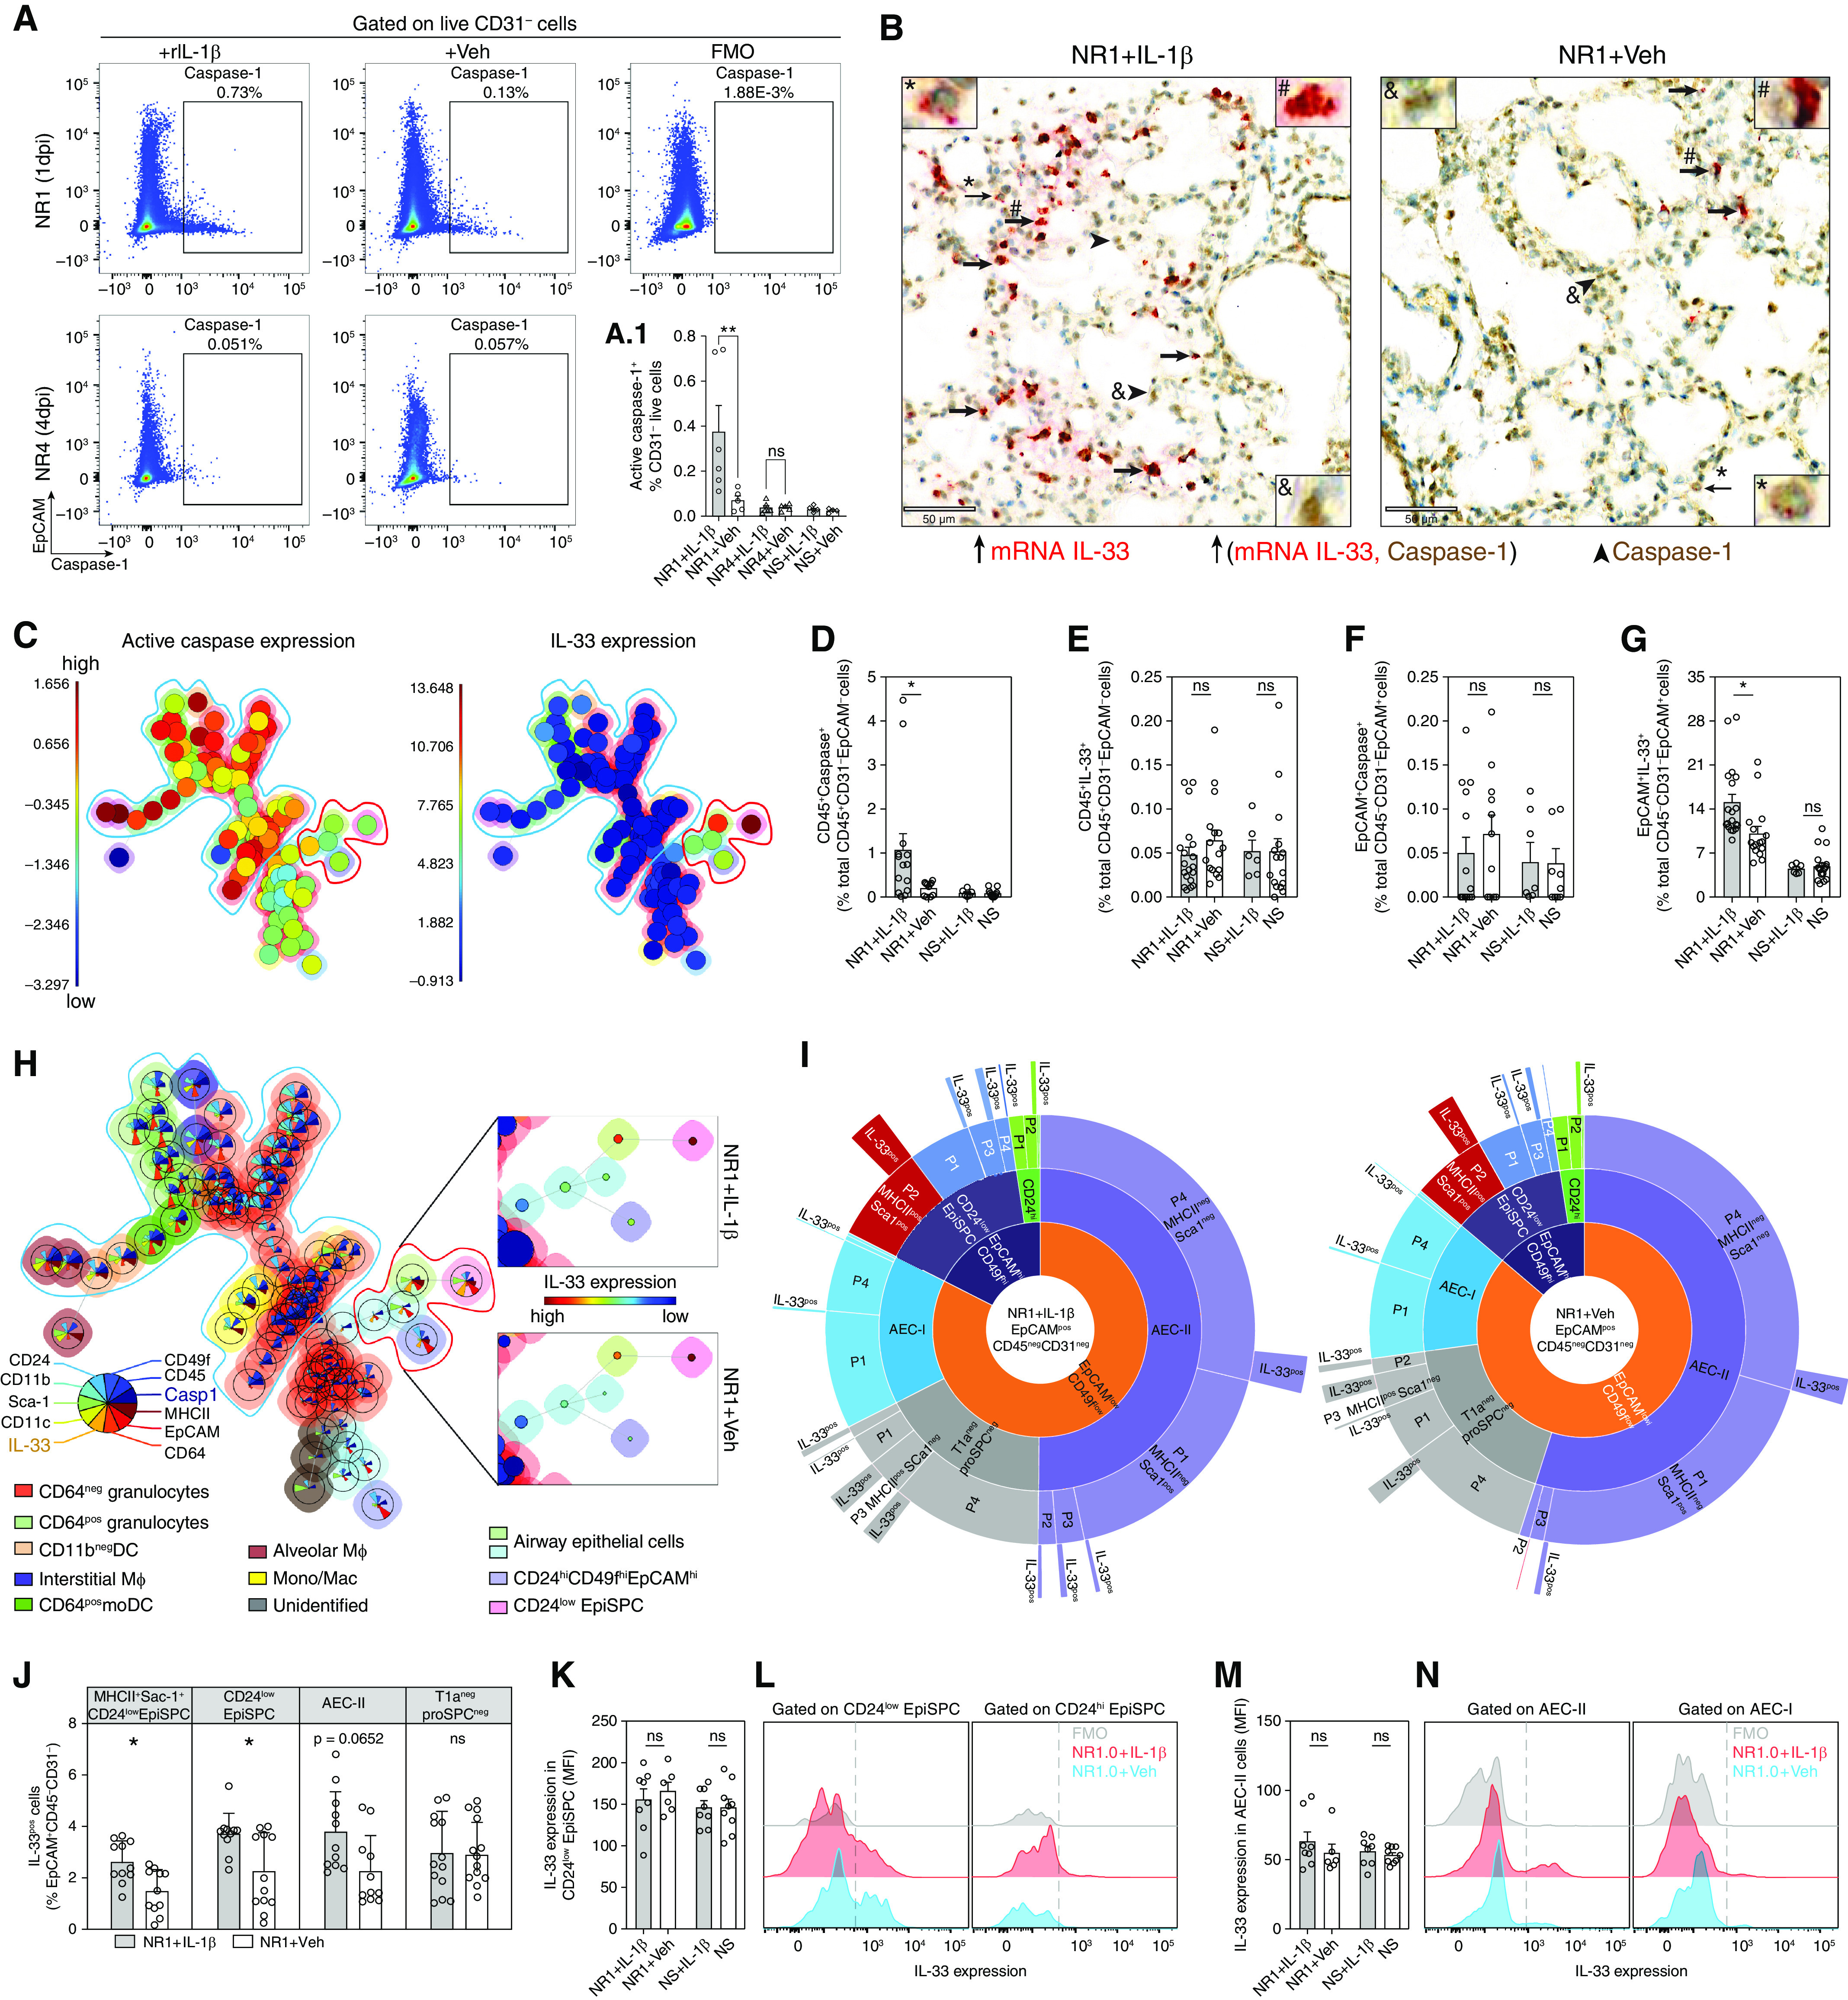
Figure 3.

IL-1β enhances IL-33 production by promoting the expansion of IL-33+ epithelial stem/progenitor cells (EpiSPCs). (A) Representative flow cytometric dot plot of total live CD31− cells from lungs of RSV-infected neonatal mice collected at 1 dpi and 4 dpi, gated on epithelial cell adhesion molecule (EpCAM) and active caspase-1. Gates for active caspase-1–positive cells were set using Fluorescence Minus One (FMO) control (top, right panel). (A1) Bar graphs illustrate the frequencies of active caspase-1–positive cells. (B) Representative dual IL-33 mRNA ISH and caspase-1 immunohistochemical sections of lungs from 3 biologically independent RSV-infected neonatal mice. IL-33 mRNA (red) and caspase-1 protein (brown) expressing cells, and collocation of IL-33 mRNA and caspase-1 protein were indicated by thick arrows, arrowheads, and thin arrows with magnified inset (#, &, and *), respectively. Scale bar, 50 μm. (C) FlowSOM visualization of the flow cytometry analysis for the pulmonary cellularity of RSV-infected neonatal mice at 1 dpi, showing the levels of active caspase-1 (left panel) and IL-33 (right panel). (D–G) The frequencies of CD45+ caspase-1+ cells (D), CD45+ IL-33+ cells (E), EpCAM+caspase-1+ (F), and EpCAM+ IL-33+ (G) in lungs of mice with different treatments. Data are representative of n = 12–16, accumulated from at least two independent experiments (mean ± SEM). (H) FlowSOM visualization of the flow cytometry analysis for the pulmonary cellularity of RSV-infected neonatal mice at 1 dpi. The color of the nodes corresponds with the distinct subpopulation. The mean marker values are visualized for each node using star charts. Each part's height indicates the intensity: if the part reaches the border of the circle, the cells have a high expression for that marker (left panel). Expression degrees (median fluorescent intensity) of IL-33 on EpiSPC and airway epithelial cells (AECs) (right top and bottom panels). The color and size of inner cycles represent the intensity of IL-33 expression and the frequencies of that population, respectively. (I) Pie charts illustrate the frequencies of different fractions of EpCAM+CD45−CD31− cells regarding IL-33 expression. (J) Bar graphs illustrate the comparison between NR1 + IL-1β and NR1 + Veh groups regarding the frequencies of IL-33+ cells. Data represent n = 16–19 accumulated from two independent experiments (mean ± SEM). (K–N) Median fluorescent intensity (MFI) levels of IL-33 expression by EpiSPC (K and L) and AEC-II and I (M and N). *P < 0.05 and **P < 0.01; compared between indicated groups using one-way ANOVA with Sidak multiple comparisons test. Data represent two independent experiments (mean ± SEM). DC = dendritic cell.
