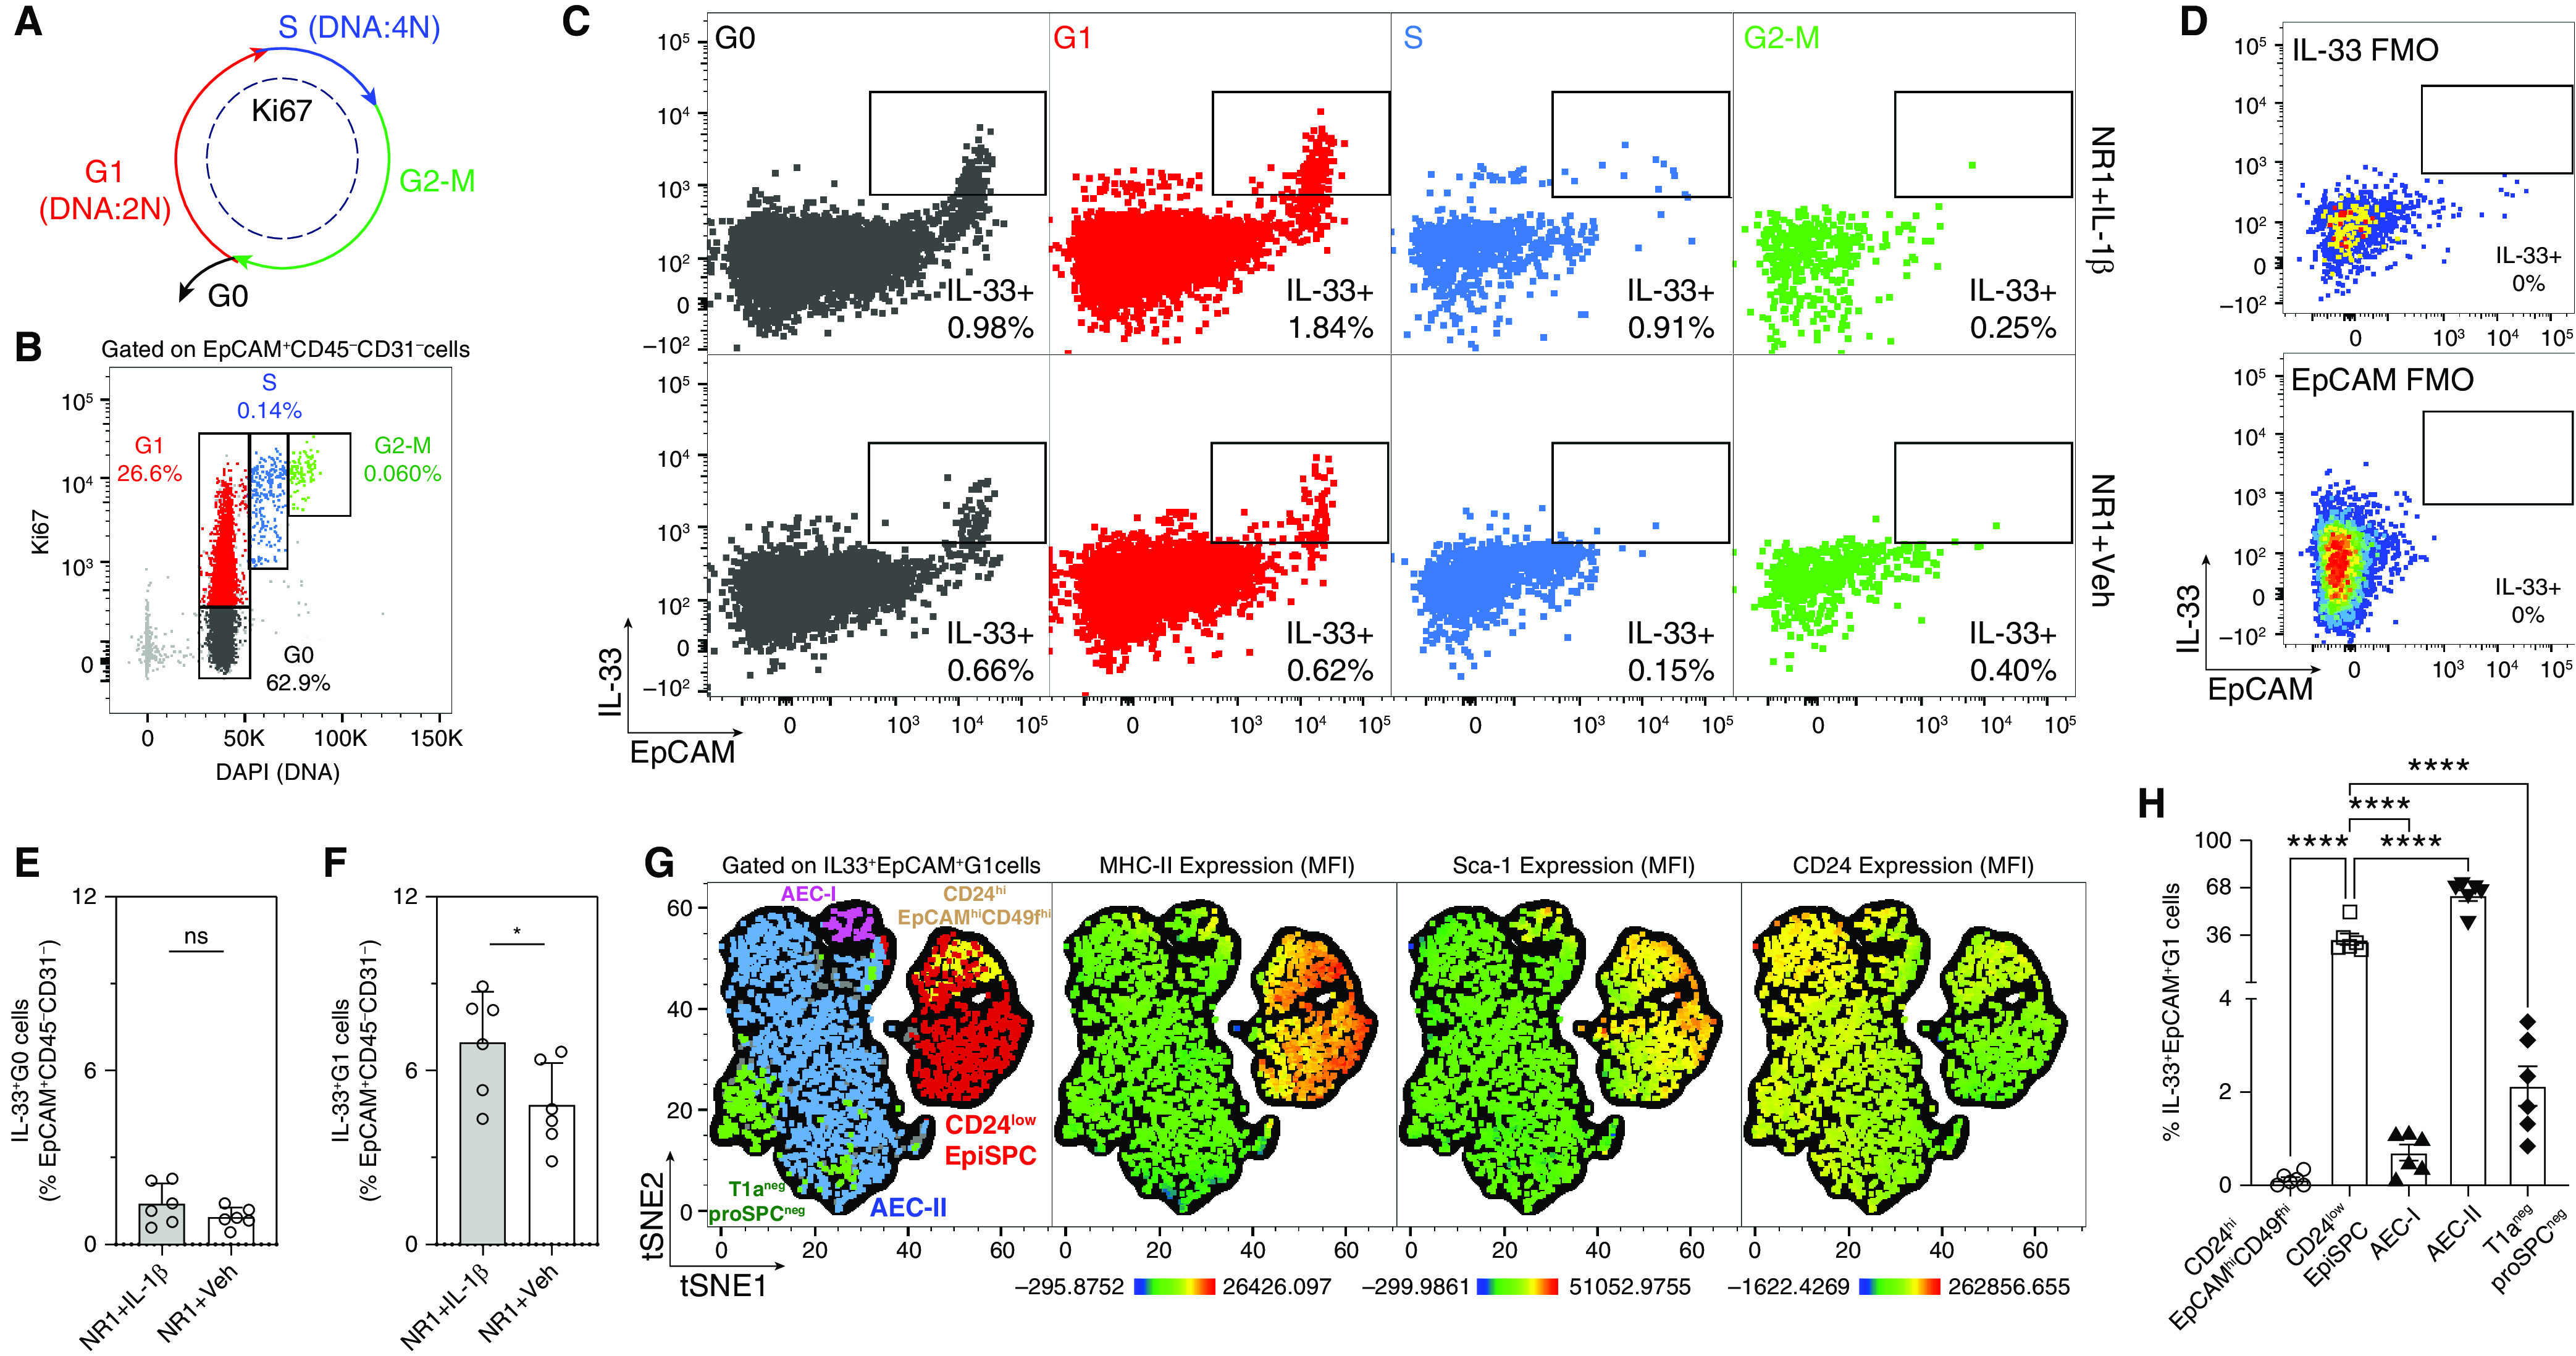
Figure 4.

IL-1β induces the proliferation of IL-33+EpiSPC. (A–D) Quantification and characterization of lung epithelial cell proliferation in neonatal mice following RSV infection. (A) Diagram shows the markers of the different phases of the cell cycle; (B and C) representative flow cytometry dot plots showing different cell cycle phases, gated on CD31−CD45−live cells; (D) FMO IL-33 was used to set gatings for IL-33+ cells. (E and F) Frequencies of IL-33+ epithelial cells had undergone resting G0 phase and proliferation G1 phase. *P < 0.05. (G) tSNE clusters of EpiSPC, AEC-II, AEC-I, and T1a−proSPC− epithelial cells from flow cytometry analysis, gated on total IL-33+EpCAM+ cells underwent G1 phase (the first panel from the left). First, the IL-33+EpCAM+ G1 populations in each sample (12 samples: 6 IL-1β and 6 treated mice) were downsampled to the minimum number of IL-33+EpCAM+ G1 events among 12 samples (2,271 events). Second, 2,271 events of the IL-33+EpCAM+G1 population from each sample were concatenated (in total, 12 × 2271 = 27252 events of IL-33+EpCAM+G1 cells). The concatenated population was then subjected to tSNE analysis. The tSNE clusters were evaluated for MHC-II, Sca-1, and CD24 expression. (H) Frequencies of IL-33+EpCAM+ cells underwent G1 phase. ****P < 0.0001 compared between indicated groups using one-way ANOVA with Sidak multiple comparisons test. Data represent two independent experiments (mean ± SEM).
