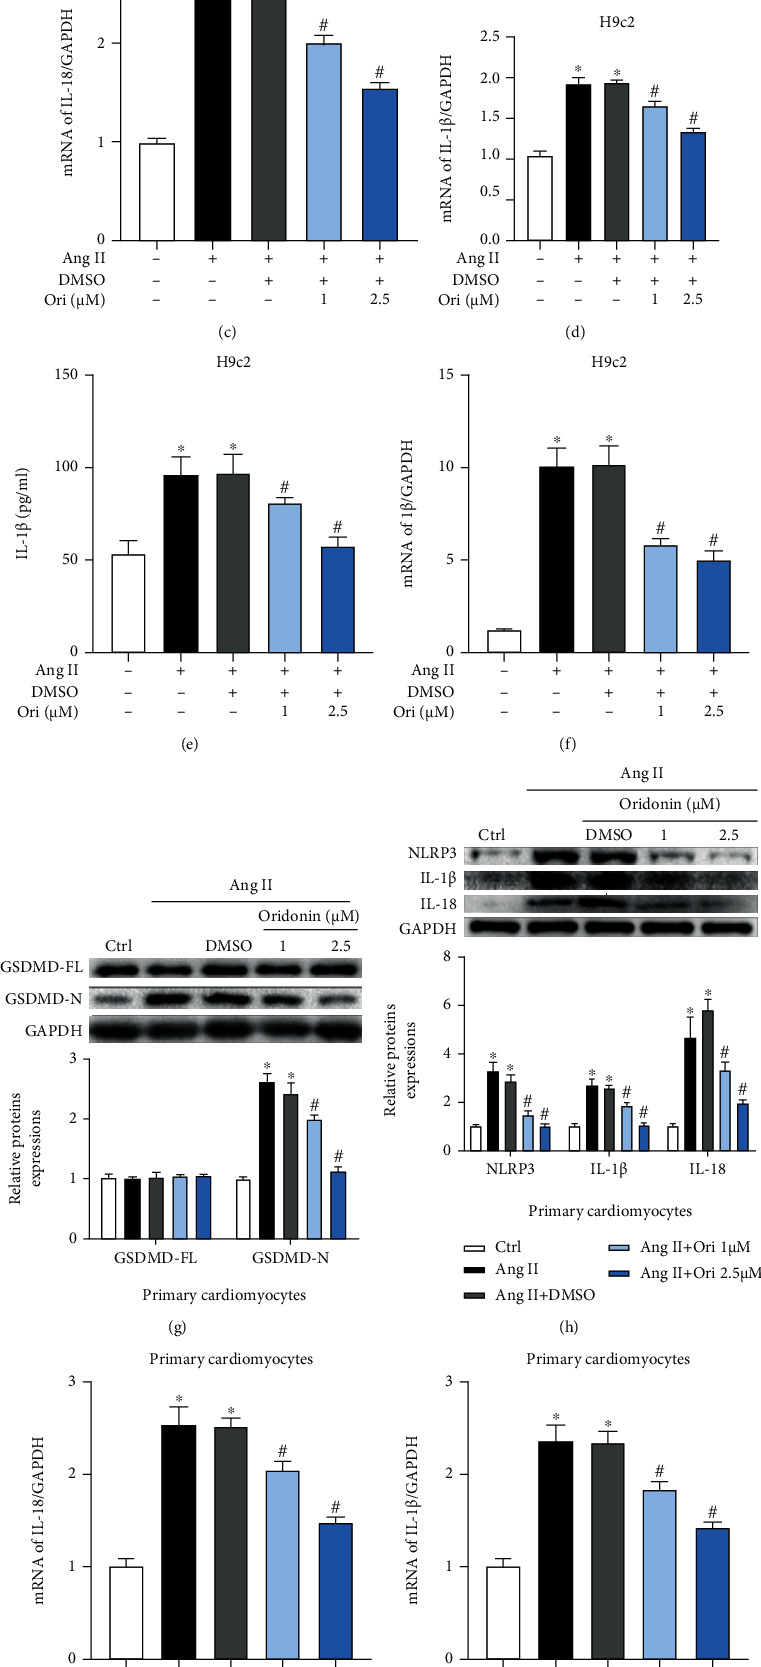
Figure 2.

Ang II-induced inflammation was inhibited by oridonin. Detection of GSDMD-mediated inflammation levels after being incubated with Ang II daylong and pretreated with different concentrations of Ori for 1 h. (a) Gel images of GSDMD and its relevant statistical graph in H9c2 cells. (b) Gel images of NLRP3, IL-1β, and I-18 and its relevant statistical graph in H9c2 cells. (c, d) The mRNA level of IL-18 in H9c2 cells. (e, f) Contents of IL-1β and LDH in the supernatant in H9c2 cells. (g) Gel images of GSDMD and its relevant statistical graph in neonatal rat cardiomyocytes. (h) Gel images of GSDMD-related inflammation factors and its relevant statistical graph in neonatal rat cardiomyocytes. (i, j) The mRNA level of IL-18 and IL-1β in neonatal rat cardiomyocytes. (k, l) Contents of IL-1β and LDH in the supernatant in neonatal rat cardiomyocytes. ∗p < 0.05 compared with control; #p < 0.05 compared with Ang II.
