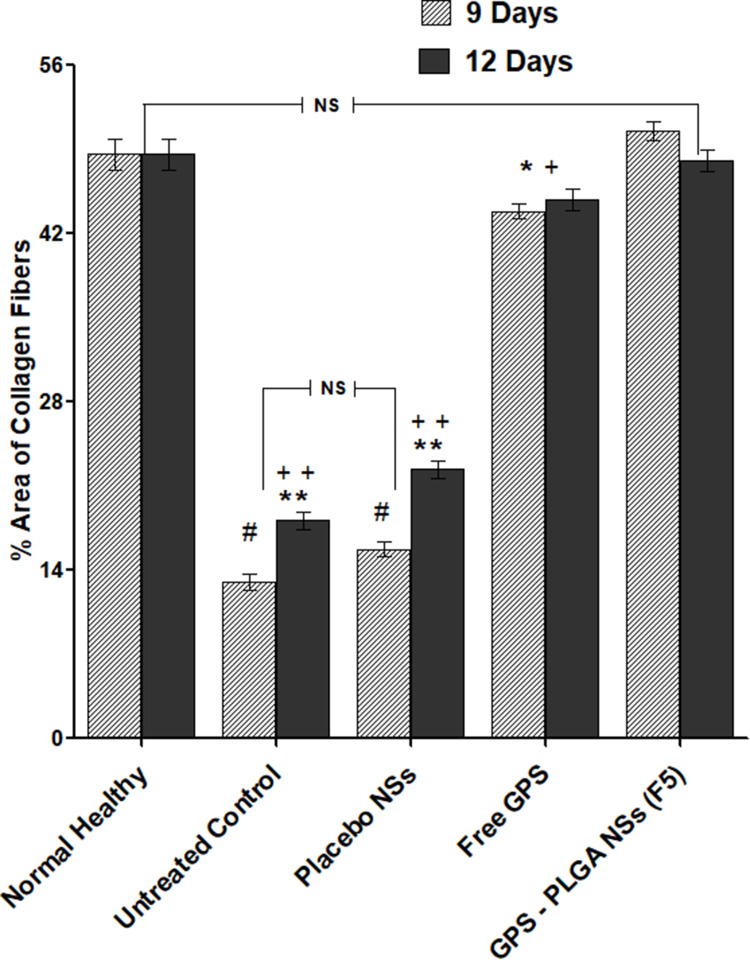
Figure 15.
Quantitative analysis for immunohistochemical staining expressed as % area of collagen fibers. Data are represented as mean ± SEM, (n=6). **p<0.01; significantly different from normal healthy. ++p<0.01 significantly different from GPS-PLGA NSs (F5). #p<0.05; significantly different from free GPS. *+p<0.05 significantly different between free GPS and normal healthy and GPA-PLGA NSs (F5). NS; the non-significant difference between normal healthy and GPS-PLGA NSs & untreated control and placebo NSs.

