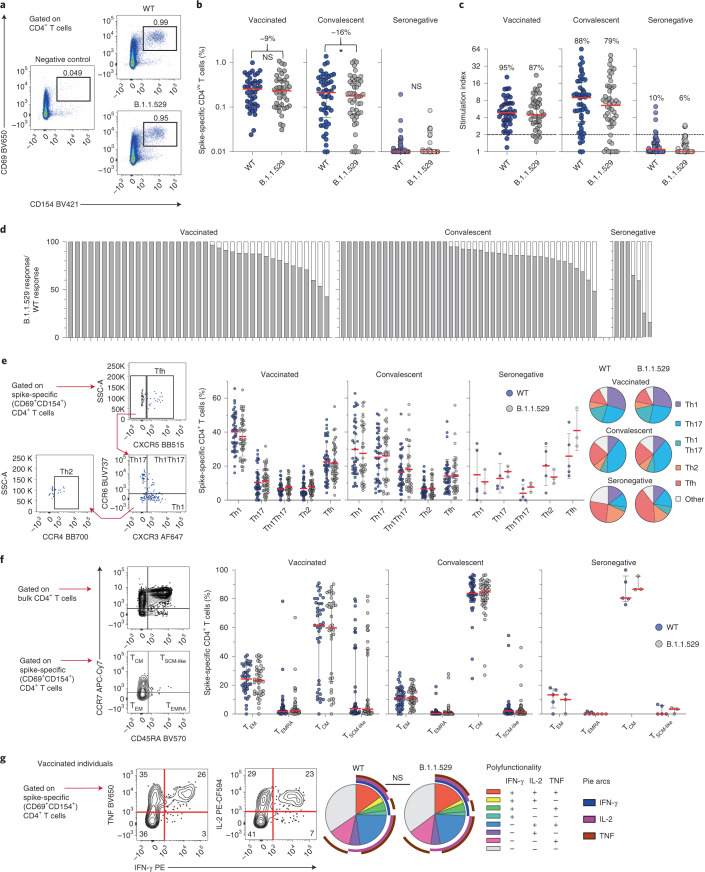
Fig. 1. Cross-reactive CD4+ T cell responses against B.1.1.529.
a, Representative flow cytometry plots showing spike-specific CD4+ T cell responses (CD69+CD154+) to peptide pools representing wild-type SARS-CoV-2 (WT) or B.1.1.529. b, Frequencies of all spike-specific CD4+ T cells in BNT162b2-vaccinated, convalescent and seronegative individuals. Numbers indicate median reduction in the frequency of detected responses. Comparisons used two-sided Wilcoxon signed rank tests. *P = 0.012. c, Stimulation indices calculated as fold change in frequency relative to the negative control. Numbers indicate the percentage of individuals with a detectable response. d, Cross-reactive responses depicted on an individual basis as percentage B.1.1.529/wild-type. e, Helper polarization of spike-specific CD4+ T cells with representative gating and dot plots showing the distribution of subsets across individuals with detectable responses. Pie charts show the mean frequency of each subset across all individuals in each group. f, Canonical memory differentiation profiles of spike-specific CD4+ T cells with representative gating and dot plots showing the distribution of subsets across individuals with detectable responses. g, Functional profiles of spike-specific CD4+ T cell responses in BNT162b2-vaccinated individuals with representative gating and pie charts showing the mean frequency for each combination. Polyfunctional responses were compared using a permutation test. Data in dot plots are shown as median ± interquartile range. Each dot represents one donor.

