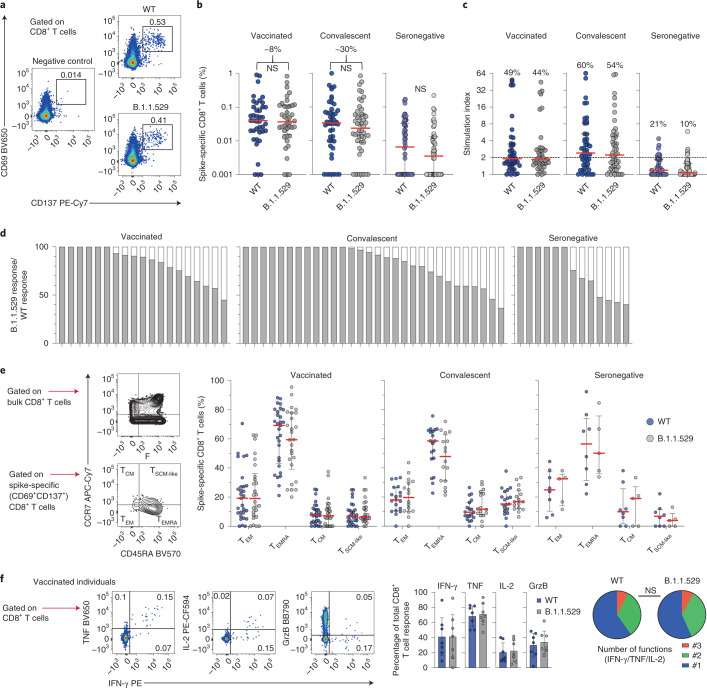
Fig. 2. Cross-reactive CD8+ T cell responses against B.1.1.529.
a, Representative flow cytometry plots showing spike-specific CD8+ T cell responses (CD69+CD137+) to peptide pools representing wild-type SARS-CoV-2 (WT) or B.1.1.529. b, Frequencies of all spike-specific CD8+ T cells in BNT162b2-vaccinated, convalescent and seronegative individuals. Numbers indicate median reduction in the frequency of detected responses. Comparisons used two-sided Wilcoxon signed rank tests. c, Stimulation indices calculated as fold change in frequency relative to the negative control. Numbers indicate the percentage of individuals with a detectable response. d, Cross-reactive responses depicted on an individual basis as percentage B.1.1.529/wild-type. e, Canonical memory differentiation profiles of spike-specific CD8+ T cells with representative gating and dot plots showing the distribution of subsets across individuals with detectable responses. f, Functional profiles of spike-specific CD8+ T cells in BNT162b2-vaccinated individuals with representative gating and pie charts showing the mean frequency for each combination. Polyfunctional responses were compared using a permutation test. Data in bar charts are shown as mean ± 95% confidence intervals, and data in dot plots are shown as median ± interquartile range. Each dot represents one donor. GrzB, granzyme B; NS, not significant.

