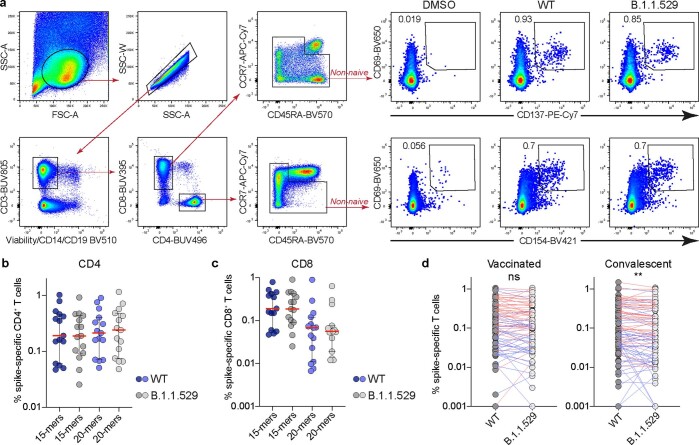
Extended Data Fig. 1. Peptide validation experiments.
a, Representative flow cytometry plots showing the gating strategy used to assess spike-specific CD4+ and CD8+ T cell responses to peptide pools representing wild-type SARS-CoV-2 (WT) or B.1.1.529. b,c, Frequencies of spike-specific CD4+ (b) and CD8+ T cells (c) in BNT162b2-vaccinated individuals, comparing test 15mer peptide pools versus validation 20mer peptide pools representing wild-type SARS-CoV-2 (WT) or B.1.1.529. d, Pairwise analysis of spike-specific CD4+ (red lines) and CD8+ T cell responses (blue lines) in BNT162b2-vaccinated and convalescent individuals. Data in dot plots are shown as median ± IQR. Each dot represents one donor. **P = 0.007 (Two-sided Wilcoxon signed rank test). ns, not significant.

