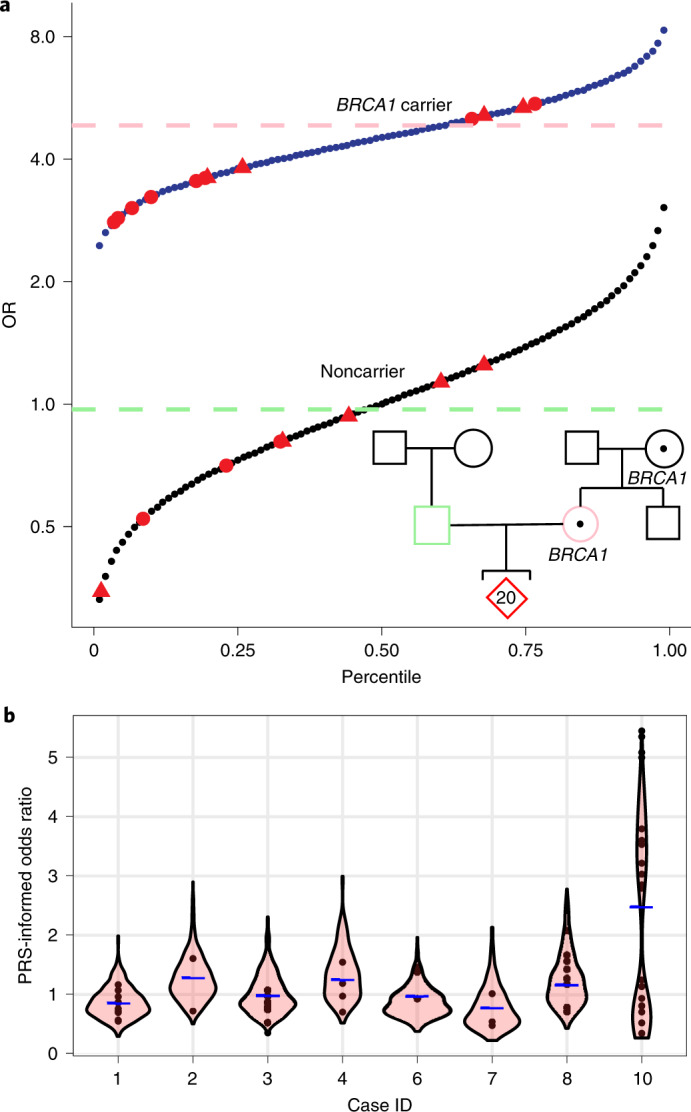
Fig. 2. Intra- and interfamilial differences in predicted genetic risk for breast cancer susceptibility.

a, Integrated polygenic/monogenic prediction in research participants with family history of breast cancer, BRCA1 variant and multiple embryos (red). Thirteen embryos carried a pathogenic BRCA1 variant. Using a logistic model fit on over 22,000 individuals in the UKB with relevant clinical and genetic information using PRS and carrier status as separate variables, we predicted the odds of disease for each embryo as per Fahed et al.12. The blue line indicates OR as a function of PRS for BRCA1 carriers, and the black line indicates OR for noncarriers. The method accounts for the reduction in effect of PRS in the context of positive BRCA1 status, captured in the difference in slope of the two lines. The female participant’s PRS is shown as a pink dashed line, and the male participant’s PRS is shown as a green dashed line (projected as female risk for comparison). Similarly, male embryos (triangles) are shown separately. b, Genomic risk for breast cancer is shown across ten couples and their embryos. Predicted genetic disease risk for each embryo (circles) is shown along with a violin-plot distribution of results from 500 simulated embryos (as described in Methods), with average parental PRS shown as a blue dash. Inheritance of a pathogenic BRCA1 variant (a) accounts for increased variability and a bimodal distribution in breast cancer disease risk for case 10.
