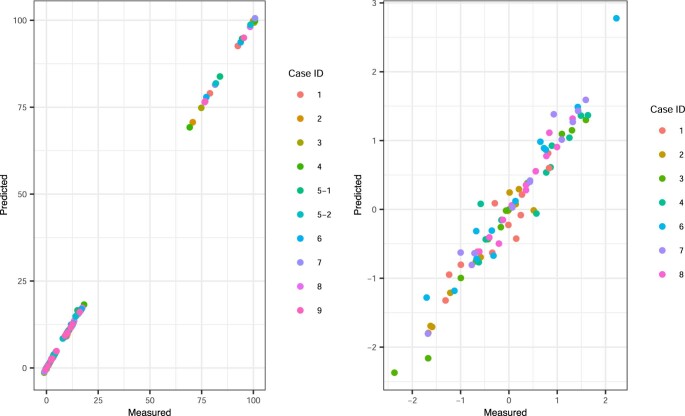
Extended Data Fig. 5. Correlation of polygenic risk score from embryo predictions and born child.
a, Illustrates the close correlation between predicted and measured (born child) raw polygenic risk score, consistent with genotype concordance between predicted and measured polygenic risk. b, Correlation between predicted and measured z-score derived from raw polygenic risk score (r2=0.947). Case IDs 5 and 9 were excluded from this analysis as the approach to mean-center polygenic risk using population ancestry is unable to account for admixture.

