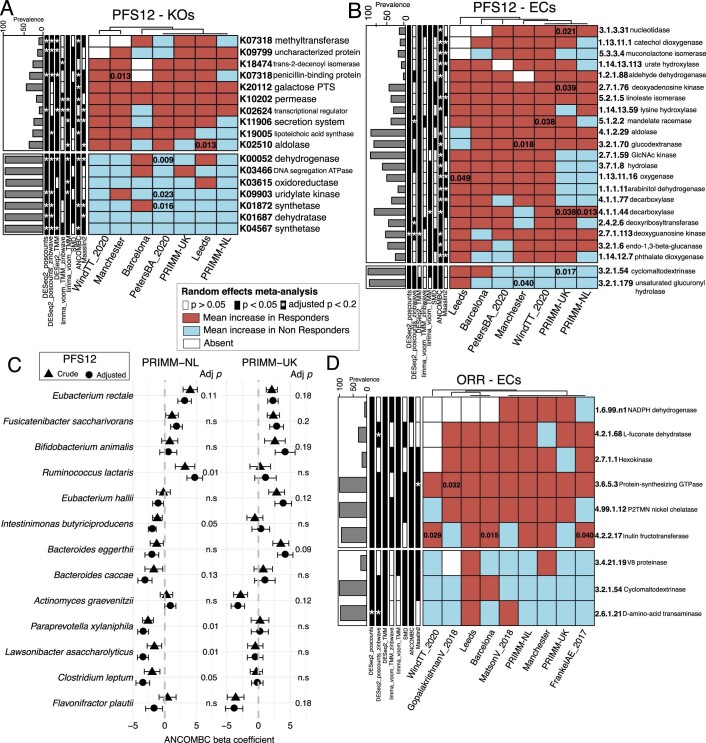
Extended Data Fig. 8. Microbiome biomarkers of response across cohorts.
(a) KEGG orthologues associated with PFS12 identified by a meta-analysis using different differential abundance methods. KEGGs shown have random-effects model p values < 0.05 in at least 6 methods out of 8 methods. Values inside the cells refer to unadjusted p values < 0.05 obtained by two-tailed Wilcoxon tests on differences in the relative abundance of responders and nonresponders. (b) Level 4 enzyme categories associated with PFS12 identified by a meta-analysis using different differential abundance methods. ECs shown have random-effects model p values < 0.05 in at least 6 methods out of 8 methods. Values inside the cells refer to unadjusted p values < 0.05 obtained by two-tailed Wilcoxon tests on differences in the relative abundance of responders and nonresponders. (c) Species associated with PFS12 in the two PRIMM cohorts before and after adjusting for confounders that included PPI, antibiotic and steroid use, gender, performance status, previous therapy, age and ICI. PRIMM-NL (n = 47) and PRIMM-UK (n = 52). Species shown have covariate-adjusted multiple hypothesis testing-corrected q < 0.2 in one of the cohorts identified by ANCOM-BC. Symbols (circles and triangles) show the ANCOM-BC beta coefficient and error lines represent the standard error. (d) Level 4 enzyme categories associated with ORR identified by a meta-analysis using different differential abundance methods. ECs shown have random-effects model p values < 0.05 in at least 6 methods out of 8 methods. Values inside the cells refer to unadjusted p values < 0.05 obtained by two-tailed Wilcoxon tests on differences in the relative abundance of responders and nonresponders.

