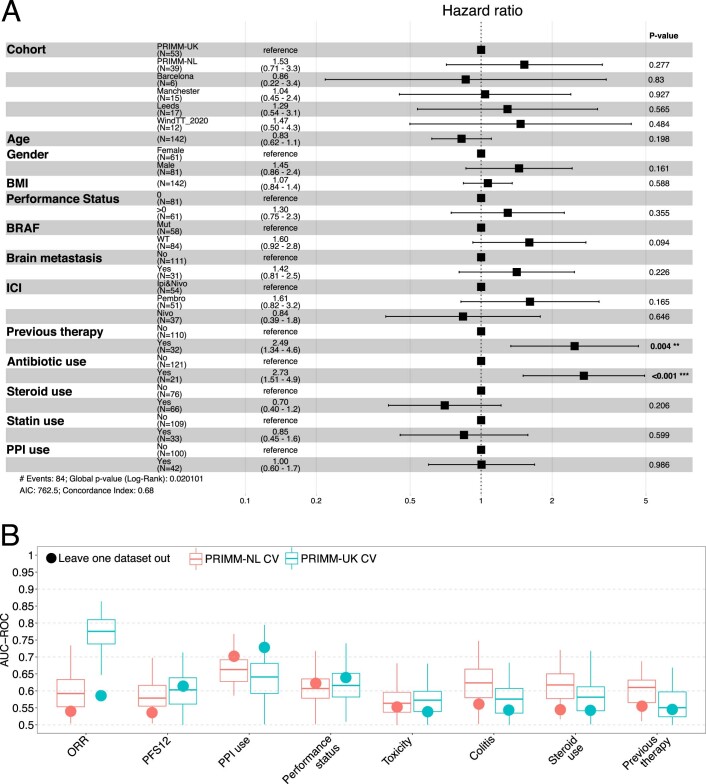
Extended Data Fig. 9. Clinical parameters associated with response and the microbiome.
(a) Forest plot showing Cox logistic regression multivariate analysis of progression-free survival. Error lines represent the 95% confidence interval of the hazard ratio. (b) Cross-validation AUC-ROC values obtained from LASSO models trained using 100-repeated fivefold stratified cross-validations (boxplots) and leave-one-dataset-out AUC-ROC values from LASSO models obtained by training the model using KEGG relative abundances and all but the corresponding PRIMM cohort (circles). PRIMM-NL (n = 55) and PRIMM-UK (n = 55). The lower and upper hinges of boxplots correspond to the 25th and 75th percentiles, respectively. The midline is the median. The upper and lower whiskers extend from the hinges to the largest (or smallest) value no further than ×1.5 interquartile range from the hinge, defined as the distance between the 25th and 75th percentiles.

