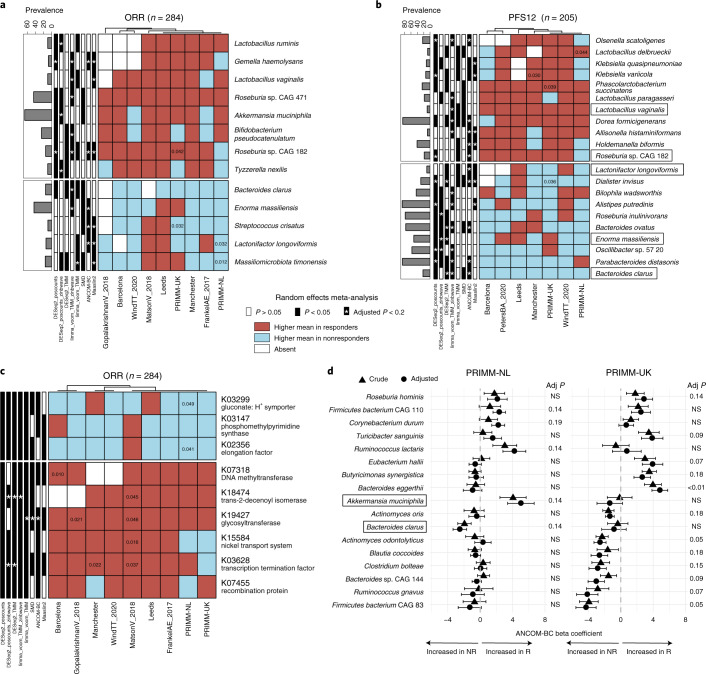
Fig. 3. A panel of potential taxonomic and function microbiome biomarkers for response across cohorts.
a, Species associated with ORR identified by a meta-analysis using different differential abundance methods. Species shown have random-effects model P values < 0.05 in at least three methods. Values inside the cells refer to unadjusted P values < 0.05 obtained by two-tailed Wilcoxon tests on differences in the relative abundance of responders and nonresponders. The color of the cell was determined by comparing the mean relative abundance in responders to nonresponders; if the mean was higher in responders, then the cells were colored red; if it was higher in nonresponders, then it was colored blue. b, Species associated with PFS12 identified by a meta-analysis using different differential abundance methods. Species shown have random-effects model P values < 0.05 in at least three methods. Values inside the cells refer to unadjusted P values < 0.05 obtained by two-tailed Wilcoxon tests on differences in the relative abundance of responders and nonresponders. c, KOs associated with response status identified by a meta-analysis using different differential abundance methods. The KEGG orthologues shown have random-effects model P values < 0.05 in at least six methods. Values inside the cells refer to unadjusted P values < 0.05 obtained by two-tailed Wilcoxon tests on differences in the relative abundance of responders and nonresponders. d, Species associated with ORR in the two PRIMM cohorts (PRIMM-NL (n = 47) and PRIMM-UK (n = 53)) before and after adjusting for covariates that included PPI, antibiotic and steroid use; gender, performance status; previous therapy; age; and ICIs. Species shown have covariate-adjusted multiple hypothesis testing-corrected q < 0.2 in one of the cohorts identified by ANCOM-BC. Symbols (circles and triangles) show the ANCOM-BC beta coefficient, and error bars represent standard error. Adj, adjusted; NR, nonresponders; R, responders; SMD, standardized mean differences.

