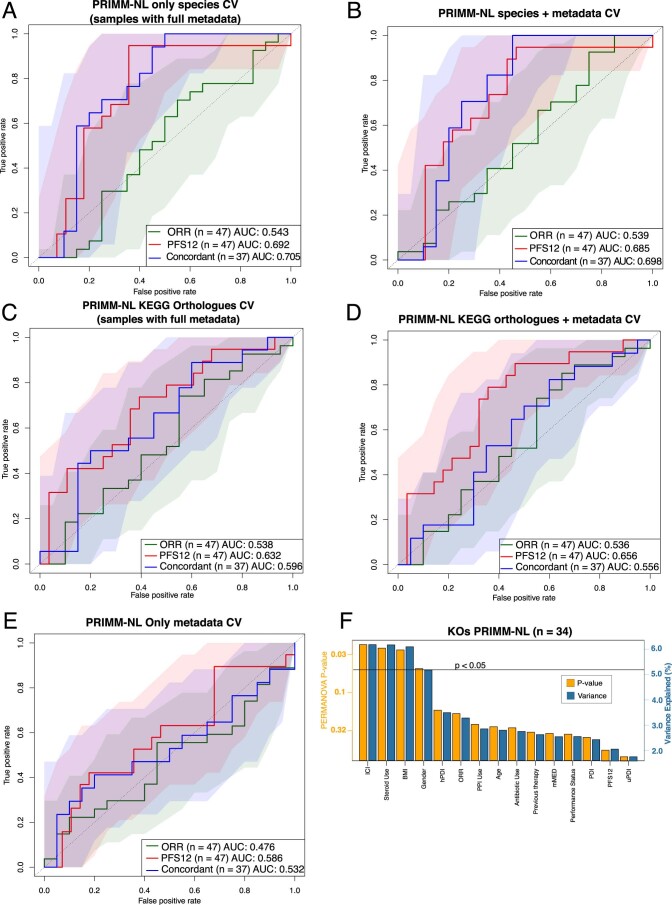
Extended Data Fig. 2. Machine learning association analysis of the microbiome and response in PRIMM-NL.
(a-e) Machine learning association analysis of the microbiome and response using either metadata alone or in combination with taxonomic (species abundance) and functional profiles (KEGG orthologs’ abundances) in PRIMM-NL. AUC-ROC curves are computed using LASSO models trained using 100-repeated fivefold-stratified cross-validations. Metadata used in the models included: age, gender, performance status, PPI use, antibiotic use, steroid use, ICI and previous therapy. Shaded areas represent AUC-ROCs from each individual machine learning model. (f) Multivariate analysis showing the amount of inferred variance explained (R2, blue vertical bars) by each identified covariate and their respective p value (orange vertical bars) as determined by PERMANOVA on KEGG clr-transformed relative abundances.

