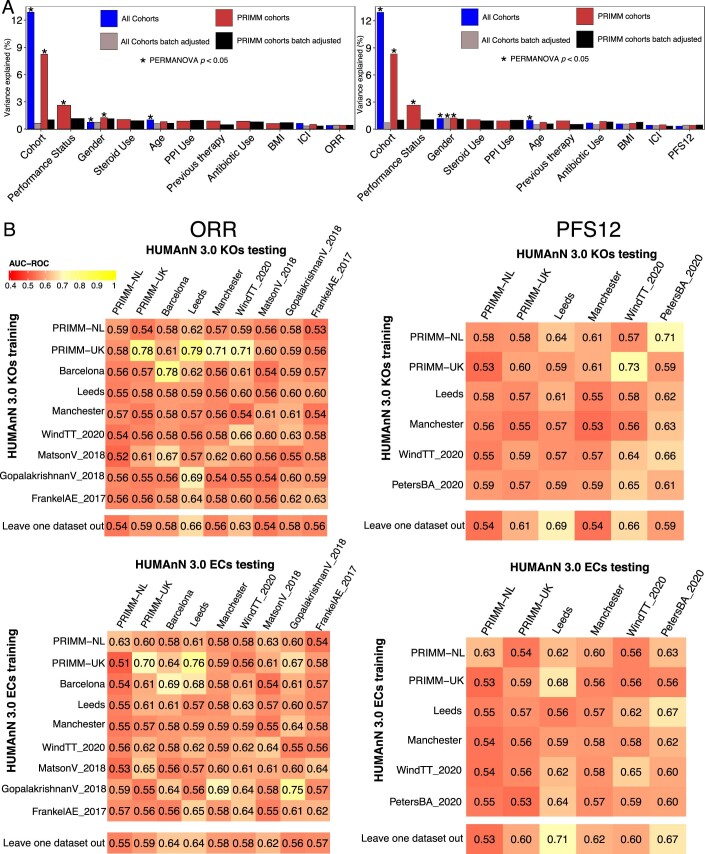
Extended Data Fig. 4. Cross-cohort response–microbiome associations at the functional level.
(a) Contribution of variables to the overall microbial community composition. Batch-correction methods were applied to KEGG abundances prior to distance calculations. The plot on the left uses ORR as the outcome variable, whereas the plot on the right adopts PFS12. (b) Prediction matrix for microbiome-based prediction of response assessed via ORR (left matrix) and PFS12 (right matrix) within each single cohort (values on the diagonal), across pairs of cohorts (one cohort used to train the model and the other for testing), and in leave-one-cohort-out setting (training the model on all but one cohort and testing on the left-out cohort). We report the AUC-ROC values obtained from LASSO models on KEGG relative abundances (top) and level 4 enzyme categories (bottom). Values on the diagonal refer to the median AUC-ROC values of 100-repeated fivefold stratified cross-validations. Off-diagonal values refer to AUC-ROC values obtained by training the classifier on the cohort of the corresponding row and applying it to the cohort of the corresponding column. The leave-one-out row refers to the performances obtained by training the model using all but the cohort of the corresponding column and applying it to the cohort of the corresponding column.

