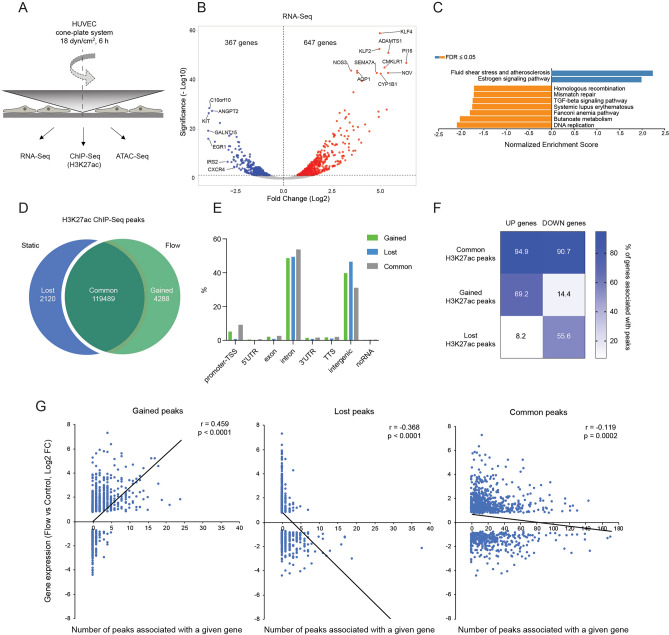
Figure 1.
Shear stress regulates the expression of a defined set of genes that correlates with enhancer activation. (A) HUVEC exposed to unidirectional shear stress (18 dyn/cm2) for 6 h were used for RNA-Seq, ATAC-Seq and H3K27ac ChIP-Seq. (B) Volcano plot showing gene expression changes in HUVEC under shear stress. Differentially expressed (DE) genes (FDR < 0.05) are labelled in red (upregulated) and blue (downregulated under shear stress). (C) Gene Set Enrichment Analysis (GSEA) of KEGG pathways regulated in the RNA-Seq dataset. (D) The number of H3K27ac ChIP-Seq peaks in HUVEC under static conditions (“lost” after shear stress) or exposed to shear stress (“gained” after shear stress) and the peaks “common” for both conditions. (E) Annotation of gained, lost and common H3K27ac peaks to defined regions of the genome. (F) Heatmap representing the spatial association of the genes up- or down-regulated by shear stress with identified common, gained or lost H3K27ac ChIP-Seq peaks. Numbers represent the percentage of up-or down-regulated genes, associated with at least one peak. (G) Comparison of gene expression (log2 fold change (FC) from RNA-Seq) to the number of gained, lost or common H3K27ac peaks spatially associated with a particular gene. Pearson correlation coefficient (r) and p-value of the correlation are shown.

