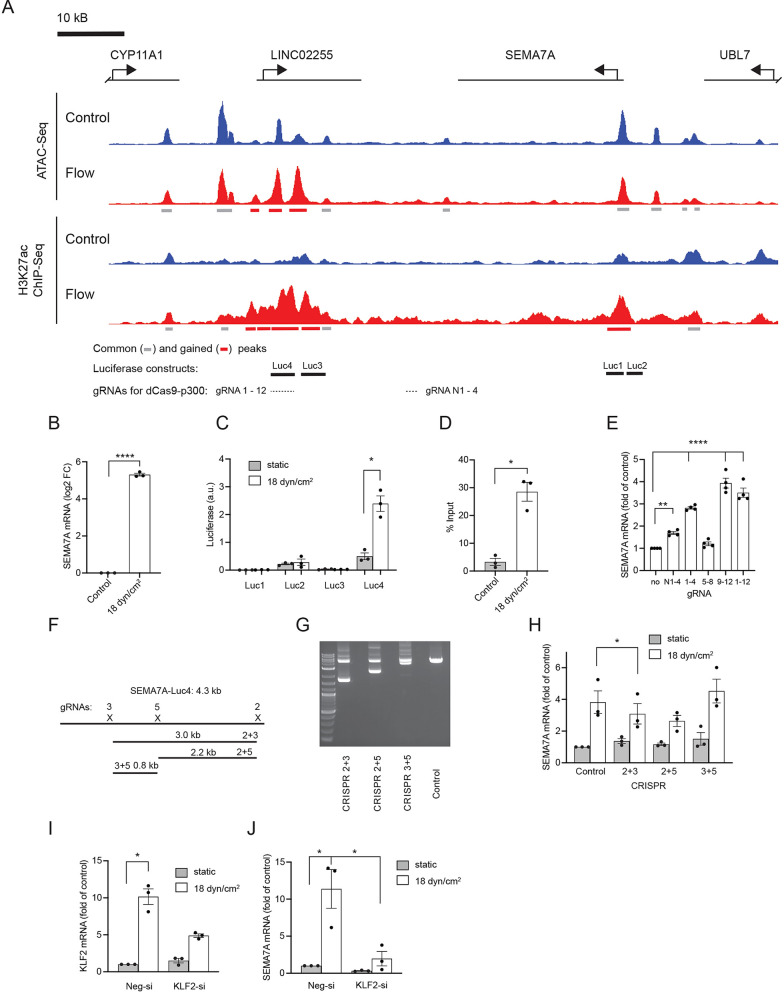
Figure 3.
Identification and characterization of a shear stress responsive enhancer in the SEMA7A gene. (A) Normalized ATAC-Seq and H3K27ac ChIP-Seq tracks in the vicinity of the SEMA7A gene. Bars below ATAC and ChIP-Seq tracks show identified common (grey) and gained (red) ATAC-Seq or H3K27ac ChIP-Seq peaks. In addition, the regions used for luciferase constructs in (C) and locations targeted by gRNAs in (E) are shown underneath the tracks. (B) SEMA7A mRNA expression in HUVEC exposed to 18 dyn/cm2 for 6 h (Log2 fold of control, mean ± sem, n = 3, ****p < 0.001, two-tailed paired t-test). (C) Luciferase assay showing luciferase activity of the constructs containing DNA regions indicated in (A) upstream of firefly luciferase in HUVEC exposed to shear stress (18 dyn/cm2 for 24 h, data are presented in arbitrary units (a.u.) after normalization to the signal of a renilla luciferase construct; mean ± sem, n = 3, *p < 0.05, two-tailed paired t-test). (D) ChIP-qPCR showing higher H3K27ac ChIP-Seq enrichment in the region corresponding to Luc4 (see (A) in HUVEC exposed to shear stress (18 dyn/cm2 for 6 h, data is presented as % input, mean ± sem, n = 3, *p < 0.05, two-tailed paired t-test). (E) SEMA7A mRNA expression in HEK293T17 cells transfected with plasmids encoding dCas9-p300 and different gRNAs (combination of 4 or 12 gRNAs) targeting genomic regions downstream of the SEMA7A gene (marked in (A); data is shown as fold of control, mean ± sem, n = 4, ****p < 0.0001, **p < 0.01, one-way ANOVA with Dunnet’s multiple comparison test). (F) Schematic representation of the genomic region corresponding to the Luc4 construct with pairs of CRISPR/Cas9 constructs designed to remove parts of the region. (G) Ethidium bromide gel showing PCR products of the genomic region corresponding to the Luc4 construct. Shorter PCR products result from the removal of targeted genomic regions. Uncropped agarose gel is shown in Suppl. Fig. 10. (H) SEMA7A mRNA expression in HUVEC infected with lentiviral constructs encoding Cas9 and gRNAs targeting genomic regions downstream of the SEMA7A gene and exposed to shear stress (18 dyn/cm2 for 6 h, data is shown as fold of control, mean ± sem, n = 3, * p < 0.05, repeated measures one-way ANOVA with Dunnet’s multiple comparison test). (I,J) KLF2 (I) and SEMA7A (J) mRNA expression in HUVEC transfected with KLF2 or control siRNA (Neg-si) and exposed to shear stress (18 dyn/cm2 for 6 h, data are presented as fold of control, mean ± sem, n = 3, *p < 0.05, one-way ANOVA with Tukey’s multiple comparison test).

