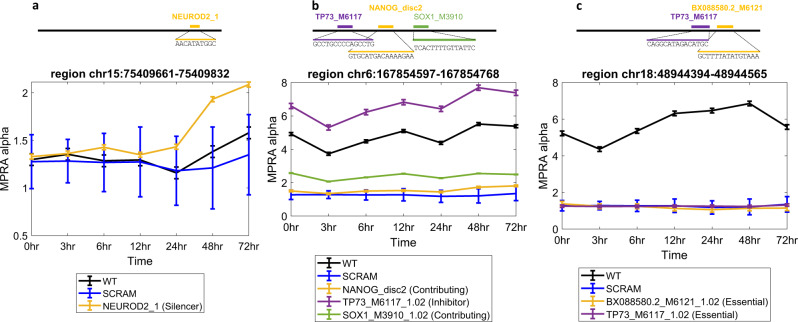
Fig. 3. Examples of the four sub-categories of FRSs.
In each figure, the WT sequence is indicated in black, centered at the mean activity and including error bars of ±1 SD across the three replicates, and SCRAM in blue including error bars of mean ± 1 SD across all scrambled sequences. Each motif is plotted in a different color, including error bars of mean ± 1 SD across the three replicates, and its perturbation effect in the regions is indicated in the text box. a NEOROD2 has a silencer effect. b NANOG, TP73, SOX1 have contributing, inhibiting, contributing effects concordantly. c BX088580.2, TP73 both have essential effects. All genomic coordinates are hg19. Source data are provided as a Source Data file.

