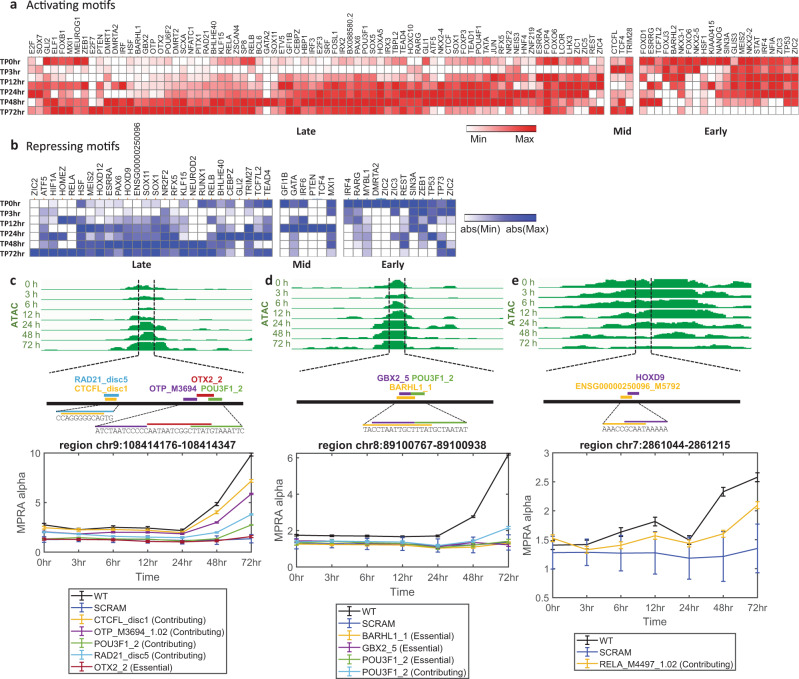
Fig. 4. Temporal motif effects.
The a activating or b repressing motifs in at least one time point. red—activator motifs, blue—repressor motifs. Color scale indicates the average of the perturbation signal (LogFC(WT/PERT)) across all significant instances of motifs for a specific TF (row normalized). Data are organized using hierarchical clustering and early, mid, and late clusters are indicated. Genome browser snapshots of assaysed sequences near predicted sequence motifs that are associated with c OTX2 and d BARHL1 TFs, showing the motifs that were perturbed and their effect on activity across time points. e HOXD9 repressor motif example. Line plots similar to Fig. 3, mean activity 1 SD across the three replicates. All coordinates are hg19. Source data are provided as a Source Data file.

