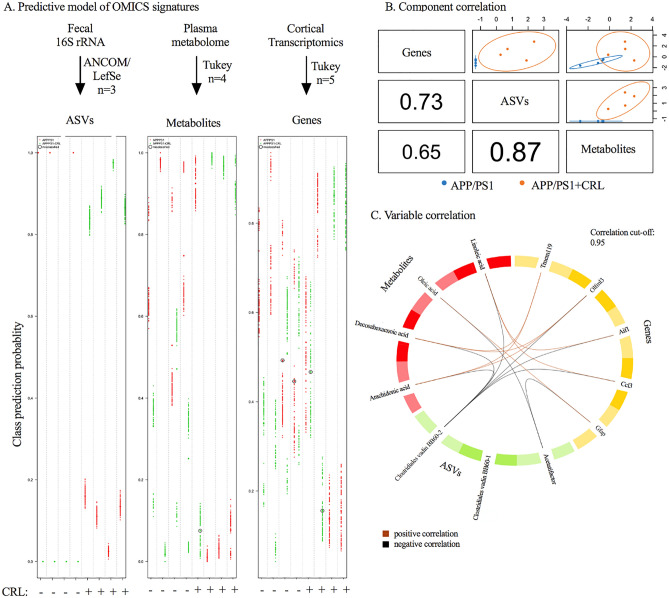
Figure 4.
Multi-Omics integration via rdCV-RF and DIABLO mixOmics analysis. A rdCV-RF analysis displayed as swim lane plot. Each swim lane displays one sample. Circled points indicate misclassified components. Each component was assessed by 200 double cross-validations to analyze class probabilities. B Component correlation of each of the three datasets determined by DIABLO analysis, which maximized the correlated information. C Variable correlation displayed in Circos plot with correlation cut-off of 0.95. Two separate pathways were identified. Positive correlation (brown), negative correlation (black).

