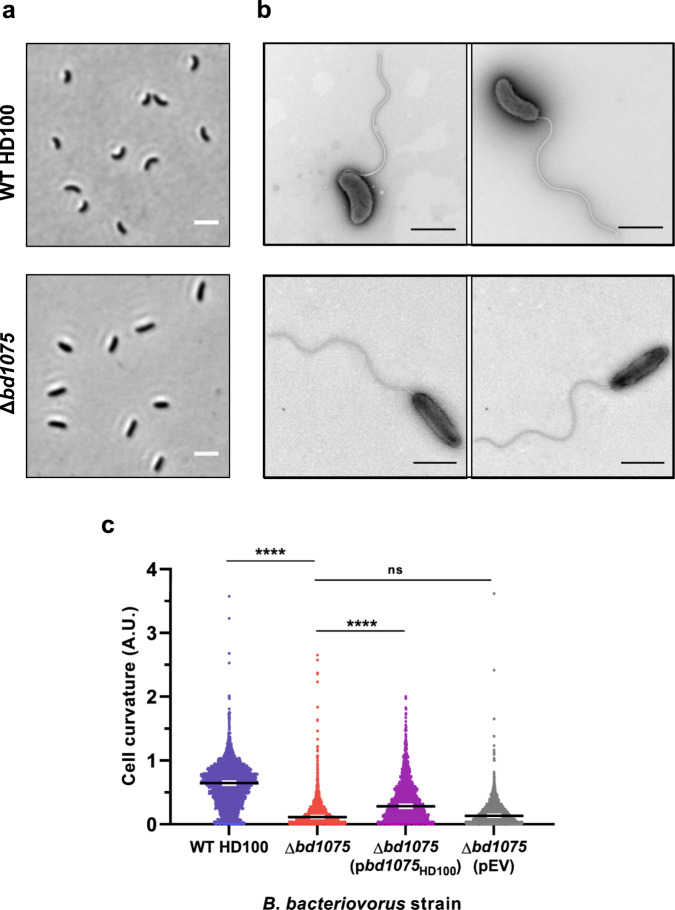
Fig. 1. Bd1075 generates the curvature of B. bacteriovorus HD100 predator cells.
a Phase-contrast images of attack-phase B. bacteriovorus cells showing the curvature of wild-type (WT) HD100 cells in comparison to non-vibrioid ∆bd1075 cells. Images are representative of cells from at least 5 biological repeats. Scale bars = 2 µm. b Transmission electron micrographs of WT HD100 and ∆bd1075 cells stained with 0.5% uranyl acetate. Scale bars = 1 µm. Images are representative of 3 biological repeats. c Curvature measurements of B. bacteriovorus attack-phase cells. n = 2503 cells (WT HD100), 2149 cells (∆bd1075), 1920 cells (∆bd1075 (pbd1075HD100)), or 2269 cells (∆bd1075 (pEV)) from 3 biological repeats. Error bars represent 95% confidence intervals of the median. ns non-significant (p > 0.05), ****p < 0.0001; Kruskal–Wallis test with Dunn’s multiple comparisons. Frequency distributions are included in Supplementary Fig. 5a. Source Data are provided as a Source Data file.

