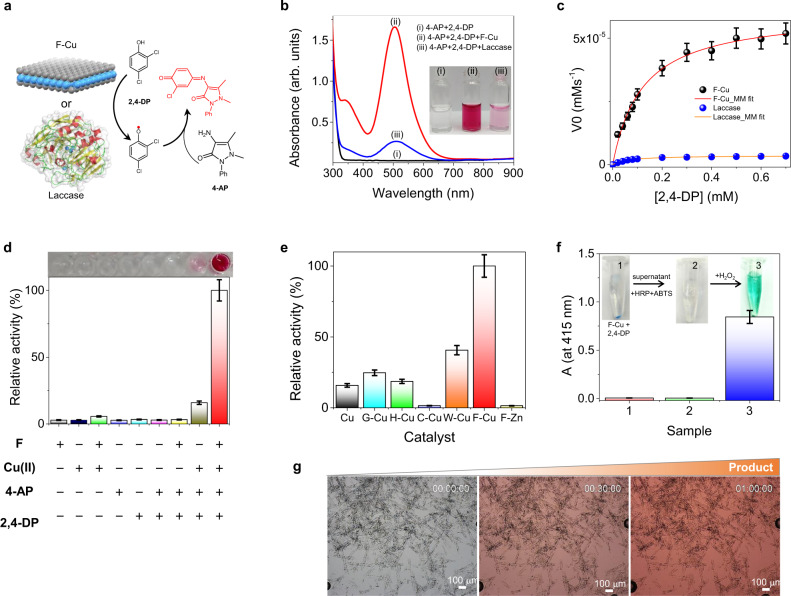
Fig. 3. The catalytic activity of the F-Cu bionanozyme mimicking laccase.
a Schematic illustration of the reaction utilizing 2,4-DP and 4-AP catalyzed by F-Cu nanosheets or laccase. b UV−vis absorption spectra of the two substrates (i) without any catalyst, and after their reaction in the presence of (ii) F-Cu and (iii) laccase. Reaction conditions: 0.6 mM 2,4-DP, 0.5 mM 4-AP, 5.04 × 10⁻⁶ mM (0.1 mg/mL) F-Cu, and 1.55 × 10⁻³ mM (0.1 mg/mL) laccase in PBS buffer (1X), pH 7.25 at 25 °C. Inset: Photographs of the corresponding solutions. c Initial rate (V0) of the reaction catalyzed by 0.1 mg/mL of F-Cu or laccase as a function of substrate concentration ([2,4-DP] = 0–0.7 mM, [4-AP] = 0.5 mM) (n = 3 independent experiments). d Relative catalytic activity in control experiments. No catalytic activity is observed when either F or Cu2+ is omitted from the system (n = 3 independent experiments). e Relative activity of several different amino acid-copper complexes (n = 3 independent experiments). f Control experiment testing the activity of the F-Cu bionanozyme and the supernatant that mimics the laccase. Photographs of (1) F-Cu reacted with 2,4-DP in PBS buffer (1X) (pH 7.25 at 25 °C) after centrifugation (12,000 rpm, 3 min), (2) the supernatant with ABTS and HRP added after centrifugation (12,000 rpm, 3 min), and (3) after adding H2O2 to (2). UV−vis absorbance at 415 nm of the corresponding samples (n = 3 independent experiments). g Optical microscopy snapshots at different intervals (0 min, 30 min, and 1 h) taken from the in situ reaction monitoring of 2,4-DP and 4-AP catalyzed by F-Cu crystals (Supplementary Movie 3), displaying the solution color change going from colorless (at 0 min) to red (after 30 min and 1 h). Error bars in all graphs represent standard deviations of three independent measurements.

