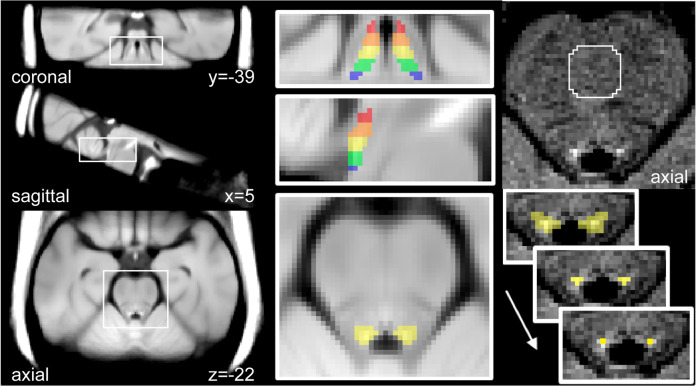
Fig. 1. Measurement of LC signal.
Left: visualization template in MNI space created by averaging the spatially normalized NM-MRI images from all participants. Middle: magnified views of the visualization template with the LC search mask overlaid. This mask was manually traced on the visualization template over the hyperintense region surrounding the LC and divided into five sections (displayed in different colors), each spanning 3 mm in the z-axis. Top-right: unprocessed NM-MRI image showing the pons of a representative individual; the central pons reference region is encircled in white. Contrast-to-noise ratio for all voxels was calculated relative to signal extracted from this region. Bottom-right: segmentation of the LC in native space. The LC search mask (yellow, signifying the middle section) was deformed from MNI space to native space to provide a search space wherein the LC was identified on left and right sides as the four adjacent voxels with highest signal contrast. To minimize partial volume effects, of these 4, only the peak-contrast voxel was retained for each side and slice. LC signal was calculated per section by averaging CNR values from all such voxels within the section.

