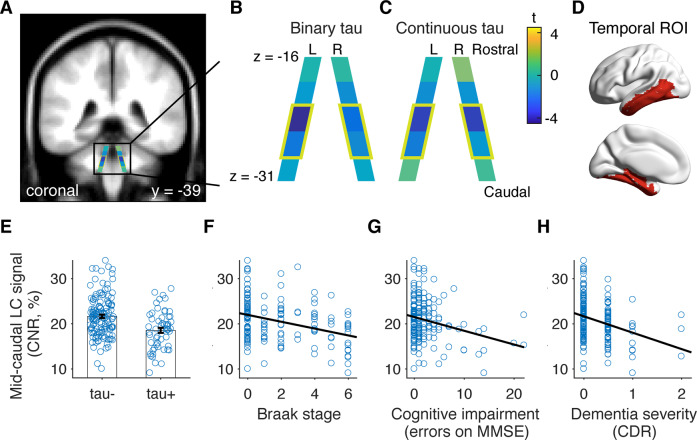
Fig. 2. LC signal and AD severity.
A–C Schematic representations of the LC. A LC schematic overlaid on anatomical template in coronal view to illustrate position in the brain. B, C LC schematic showing signal loss in each of the rostrocaudal sections based on tau burden in the temporal ROI (left hemisphere shown in D, right hemisphere is similar). In B tau burden was dichotomized ([18F]MK6240 SUVR > 1.24 to define tau-positive cases) and in C it was left as a continuous measure. The strongest relationship was seen in the mid-caudal LC sections (MNI space z coordinate = −28 to −22; encircled in chartreuse green and matching the yellow and green LC sections shown in Fig. 1). Bilateral LC signal from these sections was retained as the metric used for subsequent analyses of LC signal. Scatterplots showing relationship of mid-caudal LC signal to tau status (E) and measures of AD severity including Braak stage as determined with [18F]MK6240 PET imaging (F), cognitive impairment (G), and dementia severity (H). L left, R right, MMSE mini-mental state exam, CDR clinical dementia rating scale.

