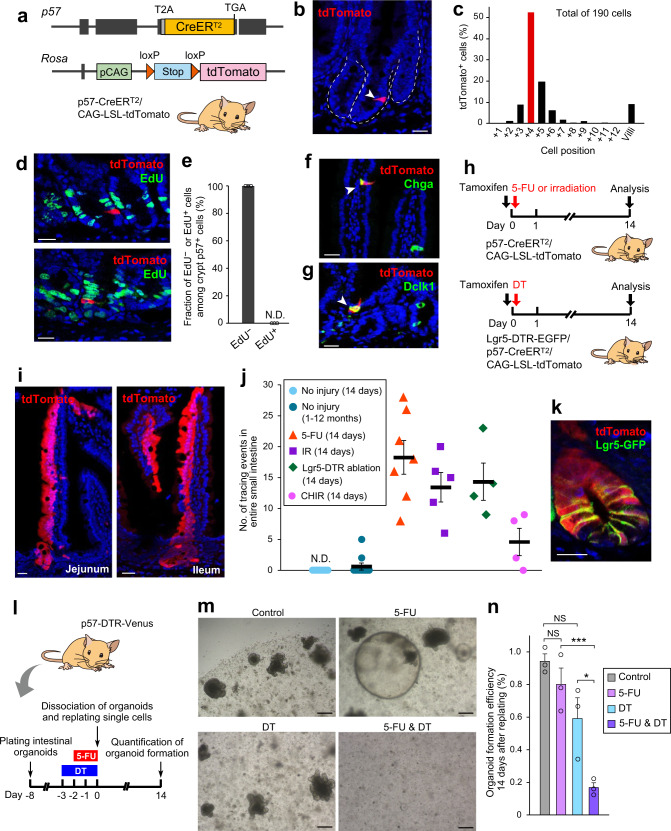
Fig. 4. Quiescent p57+ cells serve as facultative ISCs.
a Schematic representation of the p57 and Rosa gene loci of p57-CreERT2/CAG-LSL-tdTomato mice. b Representative immunofluorescence staining of tdTomato-labeled p57+ cells in the intestine. c Quantification of the number of tdTomato-labeled p57+ cells at each crypt position. d Representative immunofluorescence images of tdTomato-labeled p57+ cells and EdU in the intestine of mice subjected to 2-h EdU pulse-chase analysis. e Quantification of the fraction of EdU+ or EdU− cells among 316 tdTomato-labeled p57+ crypt cells from 3 mice. Data are means + SEM. N.D., not detected. f, g Representative immunofluorescence images of tdTomato-labeled intestinal cells (arrowheads) positive for Chga (f) or Dclk1 (g). h Dosing regimen for mice subjected to lineage tracing of p57+ cells in combination with 5-FU or radiation exposure (top) or Lgr5high cell ablation (bottom). i Representative immunofluorescence images of tracing events for p57+ cells in the jejunum (left) and ileum (right) of mice subjected to 5-FU-induced injury. j Quantification of tracing events for p57+ cells under the indicated experimental conditions. Tracing was performed for 14 days (n = 7 mice) or for 1 to 12 months (n = 10) under the homeostatic condition and for 14 days in mice either exposed to 5-FU at 150 mg/kg (n = 7), 6 Gy of IR (n = 5), or CHIR99021 at 1 mg/kg (n = 4) or subjected to ablation of Lgr5high cells (n = 4). Data are means ± SEM. N.D., not detected. k Representative immunofluorescence image of 5-FU-induced p57+ cell-derived clones containing Lgr5-GFPhigh CBCs. l Experimental protocol for evaluation of the effect of p57+ cell ablation in intestinal organoids (see Methods for details). m Representative phase-contrast images of p57-DTR-Venus organoids at 14 days after replating as in l. n Efficiency of organoid formation quantified from images as in m. Data are means + SEM (n = 3 independent experiments). NS (not significant), *P < 0.05, ***P < 0.005 (two-tailed Student’s t test). Scale bars, 20 μm (b, d, f, g, i, k) or 100 μm (m). Source data are provided as a Source Data file.

