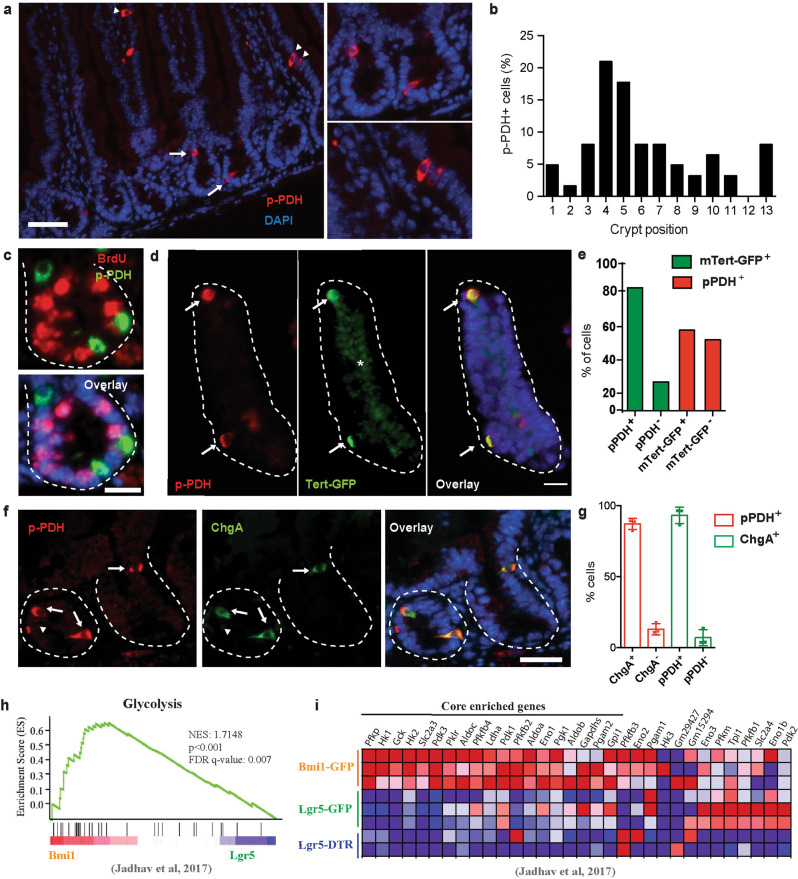
Fig. 2. High PDK activity defines +4 ISCs from EE lineage.
a Immunofluorescence of pPDH in small intestinal sections. pPDH+ cells are present in both crypts (arrows) and villi (arrowheads). On the right, magnification of intestinal crypts and villi containing pPDH+ cells. Scale bar, 100 μm. b Percentage of pPDH+ cells in every crypt position (62 pPDH+ cells form four mice were scored). c Double immunofluorescence for pPDH and BrdU. Representative image of four different mice is shown. Scale bar, 25 μm. d pPDH immunofluorescence on isolated crypts from mTert-GFP mice. Arrows mark pPDH+mTert+ cells. Asterisk marks non-specific fluorescence signal. Scale bar, 50 μm. e Quantification of pPDH+, mTert+, and pPDH+mTert+ cells in the intestinal crypts form three mTert-GFP mice. A total of 68 crypts were scored. f Double immunofluorescence for pPDH and ChgA on intestinal sections. Arrows indicate double positive cells, arrowheads indicate pPDH+ChgA− cells. Scale bar, 50 μm. g Quantification of pPDH+, ChgA+, and pPDH+ChgA+ cells on intestinal sections from three mice (at least 50 crypts/mouse were scored). Data are presented as mean ± SEM. h Gene set enrichment analysis of positive regulators of glycolysis in Bmi1-GFP cells compared to Lgr5 ISCs from Lgr5-GFP and Lgr5-DTR mice (Jadhav et al.20). i Heat map of the glycolytic gene signature from (a) showing the core enriched genes. Source data are provided as a Source Data file.

