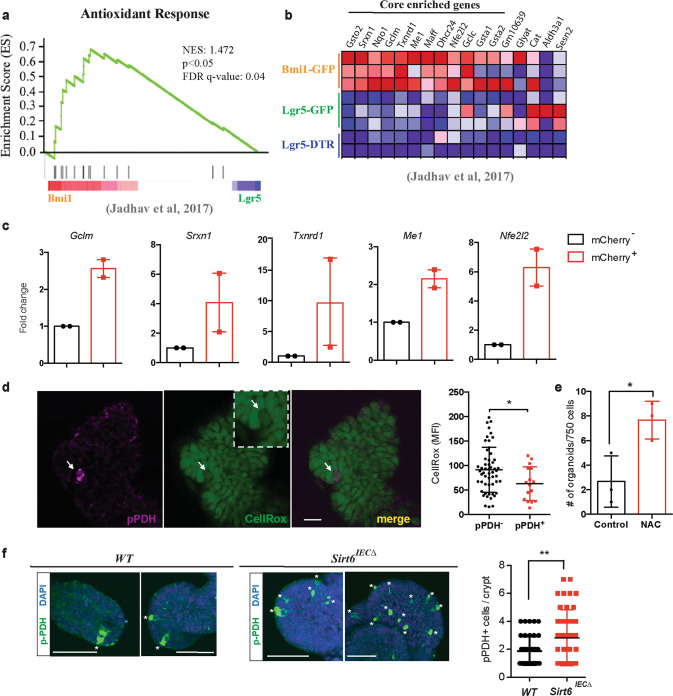
Fig. 5. Increased antioxidant response in pPDH+ cells.
a Gene set enrichment analysis of antioxidant genes in Bmi1-GFP cells compared to Lgr5 ISCs from Lgr5-GFP and Lgr5-DTR mice (Jadhav et al.20) (nominal p value = 0.013). b Heat map of the antioxidant gene signature from (a) showing the core enriched genes. c qPCR analysis showing RNA expression of indicated genes on mCherry sorted cells from two APCmin-Pdk1-mCherry organoid lines (n = 2). Data are presented as mean ± SEM. d Data represent CellRox-Green MFI of 16 pPDH+ cells from ten organoids. For each pPDH+ cell, 5–6 adjacent pPDH− cells were analyzed (total of 54 pPDH− cells from 10 organoids). Data are presented as mean ± SD (p = 0.0257). Scale bars, 25 µm. e Organoid formation efficiency of Apc; Sirt6 ΔIEC organoids treated with 200 μM NAC. Data shown are from one experiment performed in triplicate, representative of n = 2. Data are presented as mean ± SD (p = 0.0285). f Immunofluorescence of pPDH in intestinal organoids from control and Sirt6IECΔ mice (representative crypts are shown). Dot plot shows the quantification of pPDH+ cells in a total of 40 crypts from organoids derived from two control and two Sirt6IECΔ mice (p = 0.0073). Error bars indicate SD. Scale bars, 20 μm. Two tailed t-test was used to determine statistical significance between groups (*p < 0.05; **p < 0.01; ***p < 0.001). Source data are provided as a Source Data file.

