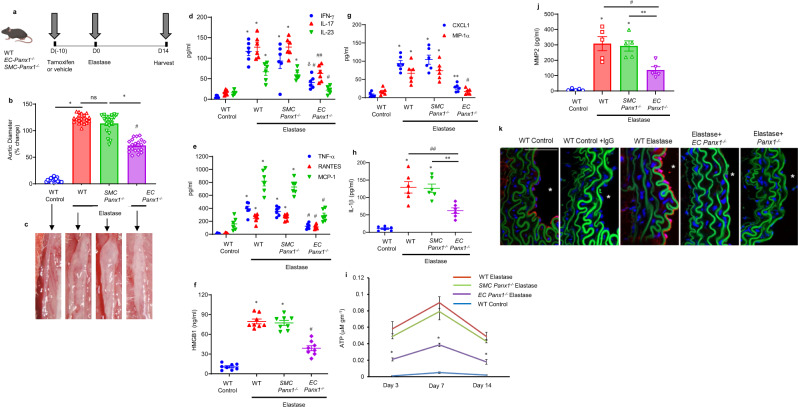
Fig. 1. Panx1 on endothelial cells regulates AAA formation and vascular inflammation.
a Schematic description of the topical elastase-treatment model is shown. Inducible knockout male mice were treated with tamoxifen for 10 days prior to elastase treatment. WT or inducible knockout male mice were then treated with topical elastase, or heat-inactivated elastase (control), on day 0, and aortic diameter was measured on day 14. b Aortic diameter is significantly reduced in elastase-treated EC-Panx1−/−, but not SMC-Panx1−/− mice, compared with elastase-treated WT mice. *P < 0.0001; #P < 0.0001 vs. WT elastase; ns, P = 0.09; n = 20 mice/group. c Representative images of aortic phenotype in all groups. d–h Pro-inflammatory cytokine expression in aortic tissue is significantly attenuated in elastase-treated EC-Panx1−/−, but not SMC-Panx1−/− mice, compared with elastase-treated WT mice. *P < 0.0001 vs. WT control; #P = 0.0004 vs. WT elastase; δP = 0.01 vs. SMC-Panx1−/− elastase; ##P = 0.001 vs. WT elastase and SMC-Panx1−/− elastase; **P = 0.002 vs. SMC-Panx1−/− elastase; n = 6/group. i Aortic tissue content of ATP was significantly attenuated in elastase-treated EC-Panx1−/−, but not SMC-Panx1−/− mice, compared with elastase-treated WT mice on days 3, 7, and 14. *P < 0.008 vs WT elastase and SMC-Panx1−/− elastase; n = 5/group. j Expression of MMP2 in aortic tissue was significantly attenuated in elastase-treated EC-Panx1−/− mice compared with elastase-treated WT and SMC-Panx1−/− mice. *P < 0.0001 vs. WT control; #P = 0.005 vs. WT elastase and **P = 0.01 vs. SMC-Panx1−/− elastase; n = 5/group. All data above are represented as mean values ± SEM and comparative statistical analyses were done by one-way ANOVA followed by multiple comparisons. k Aortic tissue from elastase-treated WT mice demonstrated a marked increase in Panx1 expression on day 14 compared with elastase-treated EC-Panx1−/− mice. *: lumen; red: Panx1; green: elastic lamina and blue, blue: DAPI. Scale bar is 50 μm; n = 5/group. Representative images from independent experimental replicates are depicted.

