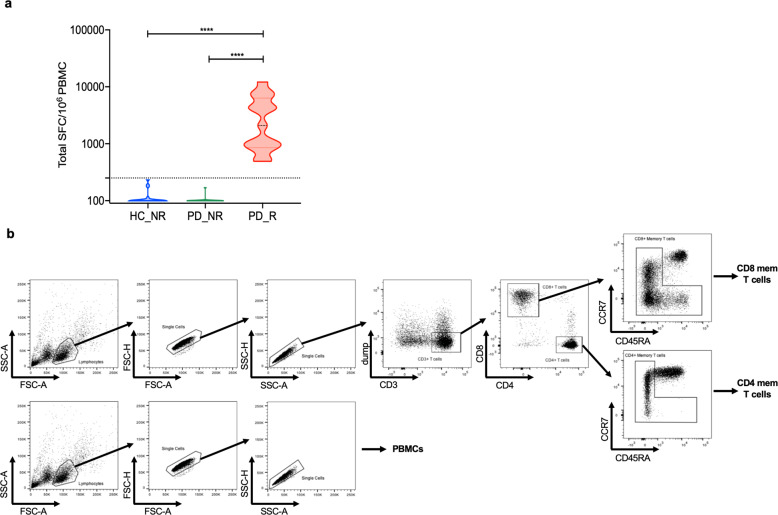
Fig. 1. Classification of PD and age-matched HC based on the α-syn T cell response.
a Violin plot shows the magnitude of T cell response (sum of IFN-γ, IL-5, and IL-10) in HC non-responders (HC_NR) (n = 20) PD responders (PD_R) (n = 15), and PD non-responders (PD_NR) (n = 21). The dotted line denotes the cut-off value of 250 SFC. Two-tailed Mann–Whitney, ****p < 0.0001. b The gating strategy was adopted to identify and sort PBMC, CD4, and CD8 memory T cells from PD and HC subjects.

